Introduction
Santa Fe Mayor Alan Webber recently announced a proposal to increase the city’s wage floor from $15 to $17.50 by 2027.[i] Mayor Webber’s proposal is welcome news to underpaid workers whose hourly wages are not enough to make ends meet. However, the proposal overlooks the tipped wage, which is effectively the shockingly low state rate of $3.00 an hour, which lags well behind many other states, including neighboring Arizona’s current tipped minimum wage of $11.70 per hour and neighboring Colorado’s current tipped minimum wage of $11.79 per hour.
We urge Mayor Webber to address this oversight by updating his proposal to also call for a “one fair wage” (the gradual elimination of the subminimum tipped wage), as seven other states and one neighboring locality (Flagstaff, AZ) have done.
The current moment is apt to address the subminimum tipped wage. Recent polling shows that wages and the economy are top of mind for voters throughout New Mexico and the country. A recent Yale Youth Poll of likely voters finds that the price of goods and services is the top issue for voters of all ages (40.3 percent), followed by the need for higher wages (23.3 percent).[ii] A July 2025 poll by Data for Progress finds that over 60 percent of voters live in economic precarity, and 54 percent do not believe that available jobs are “good paying” jobs that meet their household needs.[iii] A YouGov/CBS News Poll finds that 60 percent of voters earning under $50,000 per year rate their financial situation as “bad.”[iv] A Wall Street Journal/NORC Poll finds that a record 70 percent of voters no longer believe (or never believed) that the American dream (the idea that hard work is rewarded by prosperity) is achievable.[v]
The Typical Santa Fe Tipped Worker Earns a Low Wage
Servers and bartenders comprise the majority (52 percent) of the 4,370 tipped workers in the Santa Fe metropolitan area.[vi] In May 2024, the typical (median) wages for these occupations were $17.60 and $18.85, respectively, including tips.[vii] (See Table 1). Compared to the Santa Fe minimum wage ($14.60 in 2024), the typical server and bartender wage was only a few dollars higher (Table 2). Other tipped occupations also pay low wages, ranging from the minimum wage[1] to $17.83, inclusive of tips.
Only a small number of tipped workers earn total hourly wages substantially above ‘the Santa Fe minimum wage or above the living wage as estimated by the MIT Living Wage Calculator. As Table 1 shows, only the top 10 percent (the 90th percentile) of servers, bartenders, hairdressers, massage therapists, and shuttle drivers and chauffeurs in Santa Fe earn total hourly wages above $26 per hour. Wages for the other tipped occupations, even at the 90th percentile, are far below the living wage of $24.42 for a single adult without children.[viii]
Table 1. Hourly Wages (Cash Wage Plus Tips) for Tipped Occupations in the Santa Fe Metropolitan Area, 2024 |
|||
| Occupation | Employment | Median Wage | 90th Percentile Wage |
| Waiters and waitresses | 1,750 | $17.60 | $30.53 |
| Bartenders | 510 | $18.85 | $30.81 |
| Hosts and hostesses, restaurant, lounge and coffee shop | 450 | $14.08 * | $17.41 |
| Dining room and cafeteria attendants and bartender helpers | 490 | $15.14 | $17.25 |
| Hairdressers, hairstylists, and cosmetologists | 130 | $14.17 * | $32.19 |
| Massage therapists | 70 | $16.17 | $31.16 |
| Baggage porters and bellhops | 40 | $15.92 | $17.12 |
| Shuttle drivers and chauffeurs | 100 | $17.83 | $26.47 |
| Parking attendants | 50 | $15.63 | $18.14 |
| Maids and housekeeping cleaners | 780 | $16.01 | $18.86 |
| Total | 4,370 | — | — |
|
Source: U.S. Bureau of Labor Statistics, May 2024 Metropolitan and Nonmetropolitan Area Occupational Employment and Wage Estimates, Santa Fe, NM. * Note: The Occupational Employment and Wage Statistics (OEWS) program uses a model-based methodology to estimate occupational statistics and supplement missing establishment data, including wage data. When an establishment wage estimate is lower than the state or federal minimum wage, the higher of the state or federal minimum wage is used in the overall occupational wage estimate. (See page 21 of the OEWS technical notes here). As a result, wage estimates may not match the local minimum wage if the local wage is higher than the state or federal wage floors, as is the case with these two wage estimates. In May 2024, the Santa Fe minimum wage was $14.60, but the New Mexico minimum wage was $12.00. ** Table 1 shows median wages below the Santa Fe minimum wage for two occupations: hosts and hostesses, and hairdressers. As noted in the Table, these wage estimates are the result of the methodology used. Thus, for all intents and purposes, the typical wage for these occupations can be assumed to be the full applicable local minimum wage. |
|||
Table 2. Difference Between Median and Minimum Wage for Servers and Bartenders in Santa Fe |
|||
| Occupation | Santa Fe 2024 Minimum Wage | Median Wage | Difference |
| Waiters and waitresses | $14.60 | $17.60 | $3.00 |
| Bartenders | $14.60 | $18.85 | $4.25 |
|
NELP analysis of Santa Fe minimum wage and Bureau of Labor Statistics, May 2024 Occupational Employment and Wage Estimates. |
|||
Dozens of Localities Have Minimum Wages of $17.50 or More and Require the Full Minimum Wage as the Cash Wage
Seven states (Alaska, California, Minnesota, Montana, Nevada, Oregon, and Washington), do not allow employers to use a portion of tips as a credit towards the full minimum wage. These seven “one fair wage states” require employers to pay the full minimum wage as the cash wage with tips on top.
In addition to the seven one fair wage states, the cities of Flagstaff, Arizona, and Chicago, Illinois are currently phasing out their tipped subminimum wages. Flagstaff will have phased out the subminimum wage by January 2026,[ix] and Chicago by July 2028.[x] And other city minimum wages, including Los Angeles, Seattle, and Minneapolis, also require employers to pay the full city minimum wage as the cash wage with tips on top.
Dozens of cities and counties in one fair wage states have raised their minimum wage above the state wage floors. Table 3 lists cities and counties with one fair wage policies in effect in 2025 and those (Flagstaff and Chicago) in the process of phasing out their subminimum tipped wages.
Table 3. Cities and Counties with One Fair Wage Policies |
||||
| Local Jurisdiction | Current Minimum Wage | Local Jurisdiction | Estimated 2027 Minimum Wage | |
| Flagstaff, AZ
(one fair wage by 2026) |
$17.85 (regular)
$16.85 (tipped) |
Redwood, CA | $18.20 | |
| Alameda, CA | $17.46 | Richmond, CA | $17.77 | |
| Belmont, CA | $18.30 | San Carlos, CA | $17.32 | |
| Berkeley, CA | $19.18 | San Diego, CA | $17.25 | |
| Burlingame, CA | $17.43 | San Francisco, CA | $19.18 | |
| Cupertino, CA | $18.20 | San Jose, CA | $17.95 | |
| Daly City, CA | $17.07 | San Mateo, CA | $17.95 | |
| East Palo Alto, CA | $17.45 | San Mateo County, CA | $17.46 | |
| El Cerrito, CA | $18.34 | Santa Clara, CA | $18.20 | |
| Emeryville, CA | $19.90 | Santa Monica, CA | $17.81 to $21.01 * | |
| Foster City, CA | $17.39 | Santa Rosa, CA | $17.87 | |
| Fremont, CA | $17.75 | Sonoma, CA | $16.96 to $18.02 * | |
| Half Moon Bay, CA | $17.47 | South San Francisco, CA | $17.70 | |
| Hayward, CA | $16.50 to $17.36 * | Sunnyvale, CA | $19.00 | |
| Los Altos, CA | $18.20 | West Hollywood, CA | $19.65 to $20.22 * | |
| Los Angeles, CA | $17.87 to $22.50 * | Chicago, IL
(one fair wage by 2028) |
$16.20 (regular)
$11.02 (tipped) |
|
| Los Angeles County, CA | $17.81 | Minneapolis, MN | $15.97 | |
| Malibu, CA | $17.27 | Saint Paul, MN | $13.25 to $15.95 * | |
| Menlo Parl, CA | $17.10 | Bellingham, WA | $18.66 | |
| Milpitas, CA | $18.20 | Burien, WA | $16.66 to $21.16 * | |
| Mountain View, CA | $19.20 | Everett, WA | $18.24 to $20.24 * | |
| Novato, CA | $16.50 to $17.27 * | King County, WA | $17.29 to $20.29 * | |
| Okland, CA | $16.89 to $24.48 * | Renton, WA | $16.66 to $20.90 * | |
| Palo Alto, CA | $18.20 | SeaTac, WA | $20.17 | |
| Pasadena, CA | $18.04 | Seattle, WA | $20.76 | |
| Petaluma, CA | $17.97 | Tukwila, WA | $16.66 to $21.10 * | |
|
* Minimum wage varies within those ranges, depending on business size (i.e., number of employees) and/or industry. |
||||
Tipped Workers Experience Higher Rates of Poverty than Other Workers
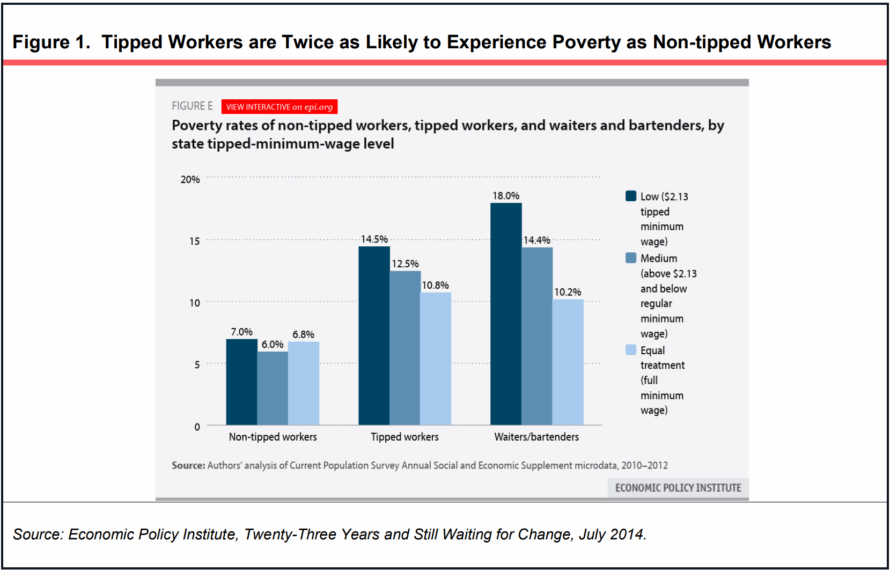
Tipped workers are twice as likely to live in poverty as other workers. According to analysis by the University of California and the Economic Policy Institute, while the poverty rate for non-tipped workers in the U.S. was 6.5 percent during the period analyzed (2010–2012), the poverty rate for tipped workers was 12.8 percent. Restaurant servers and bartenders, who comprise the largest share of all tipped workers, had an even higher poverty rate of 14.9 percent.[xi]
When looking specifically at states with a subminimum tipped wage, the researchers found that poverty among tipped workers was even more prevalent. While the poverty rate for non-tipped workers ranged from 6.0 to 7.0 percent in those states, for tipped workers the poverty rate jumped to more than twice that rate—between 12.5 and 14.5 percent.[xii]
Poverty among servers and bartenders in those states was even more alarming: 18.0 percent in states that follow the federal tipped rate of $2.13, and 14.4 percent in states with tipped subminimum wages between the federal tipped floor and the full minimum wage.[xiii]
This analysis suggests that in states with subminimum tipped wages, tipped workers are more than twice as likely to live in poverty. In comparison, the gap in the poverty rates for tipped and non-tipped workers in One Fair Wage states—where the full minimum wage is the cash wage, with tips on top—was significantly narrower (Figure 1).
The Tipped Subminimum Wage Contributes to the Precarity of Tipped Work
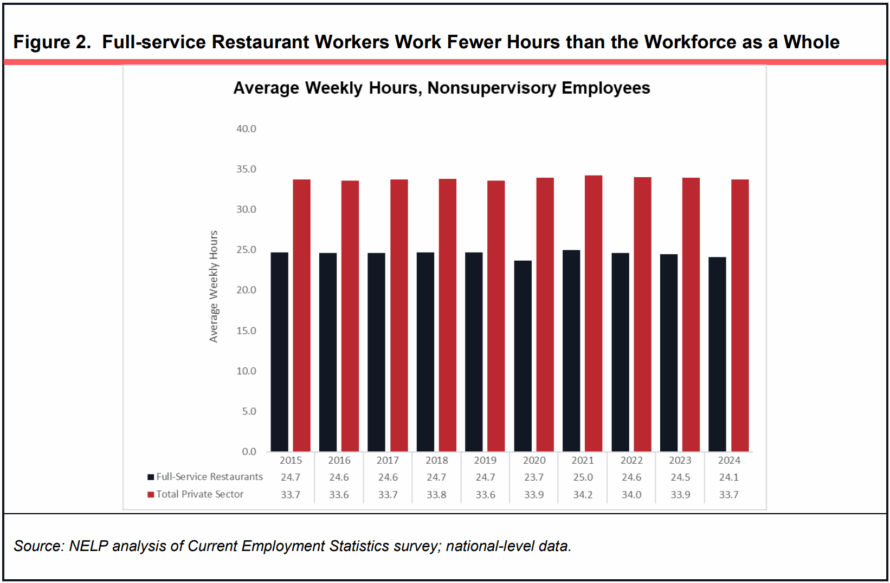
Tipped workers have unpredictable incomes and schedules. Their take-home pay fluctuates widely depending on the seasons, the shift they are given, and the generosity of customers.
While the average number of hours worked for all employees in the private sector was nearly full-time (33.7 hours per week) in 2024, full-service restaurant workers worked 24.1 hours per week on average,[xiv] reflecting the precarity of work in the restaurant industry. This disparity has held steady over the past decade (Figure 2).
The subminimum tipped wage adds to the challenges of making ends meet on fewer than average hours, as it requires tipped workers to rely on tips for the bulk of their earnings. Santa Fe’s minimum wage law does not set a cash wage for tipped workers,[xv] though virtually all affected tipped workers would be covered under the state tipped wage rate. (The Santa Fe County minimum wage ordinance, which has a set base cash wage for tipped workers, does not apply to incorporated cities in the County).[xvi] Currently, the New Mexico tipped subminimum wage is only $3.00 per hour,[xvii] or just 20 percent of the full minimum wage in the city of Santa Fe. This means that tipped workers who are paid the subminimum tipped wage depend on tips for 80 percent of their incomes.
The lack of stable or sufficient incomes for tipped workers makes it difficult to plan a family budget. As discussed above, the living wage for single adults without children in the Santa Fe metropolitan area is estimated to be $24.42, or more than eight times the current cash wage of $3.00. Single parents raising one child need to earn at least $43.67 per hour, or nearly fifteen times the tipped subminimum wage.
Although the full minimum wage of $15.00 is also not sufficient to cover basic necessities such as rent, groceries and transportation, it is much closer to the living wage. If tipped workers could count on the full minimum wage as their cash wage, with tips on top, the gap between their earnings and the living wage would greatly narrow.
Eliminating the Subminimum Tipped Wage is a Matter of Basic Fairness and Racial and Gender Justice
The tipped subminimum system is a legacy of slavery, and to this day continues to harm workers of color, in particular women of color.[xviii]
In Santa Fe County, workers of color (inclusive of Latinx workers of any race) comprise an overwhelming 75.4 percent of tipped workers. Among servers and bartenders, workers of color make up a smaller share, yet still a majority: 51.6 percent.[xix] Women comprise 79.4 percent of all tipped workers, and 56.8 percent of servers and bartenders.[xx] (Table 4). Given the composition of the County’s tipped workforce, tipped wage policy is a matter of racial and gender justice.
Table 4. Racial and Gender Composition of the Tipped Workforce in Santa Fe County, NM |
|||
| Tipped (All Occupations) | Servers and Bartenders | Non-Tipped | |
| Gender | |||
| Female | 79.4% | 56.8% | 50.6% |
| Male | 20.6% | 43.2% | 49.4% |
| Race and Ethnicity: | |||
| White | 24.6% | 48.4% | 43.4% |
| Workers of color, not Latinx | 1.1% | 1.6% | 7.9% |
| Latinx, any race | 74.3% | 50.0% | 48.7% |
|
Source: NELP analysis of American Community Survey 1-Year Estimates Public Use Microdata Sample (2023). |
|||
Sexual harassment is rampant in the accommodations and food services industry. Analysis of Equal Employment Opportunity Commission (EEOC) data between 2005 and 2015 shows that over 14 percent of all sexual harassment filings originated in the accommodations and food service industry—the highest among the 20 industries identified in filings.[xxi] A 2021 survey of restaurant workers found that 76 percent of tipped workers in the industry experienced and felt compelled to tolerate sexual harassment, while a smaller share (52 percent) of their non-tipped counterparts did.[xxii] Other research shows a connection between the sexualization of women’s bodies and the practice of tipping, with more attractive (and usually white) female servers reporting higher tips, compared to their peers.[xxiii]
The Tipped Subminimum Wage is an Unfair and Unnecessary Subsidy for Employers in a Healthy Restaurant Industry
Tips are supposed to reward good service, not serve as a subsidy to employers. Yet, in jurisdictions with a subminimum tipped wage, tips essentially transfer employers’ responsibility for paying wages onto customers. This practice mainly benefits employers in the restaurant industry where the majority of tipped workers are employed. No other industry is subsidized this way.
Employers in the restaurant industry are among the most avid users not only of the tipped subminimum wage, but also of the standard minimum wage, and they are among the least likely to offer workplace benefits such as health insurance, paid sick leave, and paid holidays—making the industry one of the least generous,[xxiv] despite healthy indicators. According to the National Restaurant Association, nationwide industry sales were expected to reach $1.1 trillion in 2024[xxv] and are expected to reach a record $1.5 trillion this year.[xxvi] The industry is expected to employ 15.9 million workers by the end of this year,[xxvii] and add 1.2 million jobs over the next seven years, employing 16.9 million workers by 2032.[xxviii]
The Tipped Subminimum Wage System is Difficult to Enforce, and Contributes to Wage Law Violations
In jurisdictions without a one fair wage, employers are required by law to make up the difference between the cash wage and the full minimum wage if employees’ tips do not bring them to at least the minimum wage. However, the complexity of the tipped subminimum wage system makes enforcement difficult. Between 2010 and 2012, he U.S. Department of Labor found an 83.8 percent noncompliance rate among the nearly 9,000 full-service restaurants it investigated. Violations included tip credit infractions and other forms of wage theft, resulting in $56.8 million in back pay for affected workers, including $5.5 million related to tip wage violations.[xxix]
More recently, 59 percent of tipped workers reported wage theft related to tips.[xxx] And analyses of complaints investigated by the U.S. Labor Department Wage and Hour Division and by state departments of labor and attorneys general, show that wage theft continues to be prevalent in the restaurant industry. A 2018 analysis by Good Jobs First finds that the restaurant and food services sector ranks 8th out of 18 industries with the most wage theft lawsuits.[xxxi] Among the largest restaurant groups—which own or manage thousands of restaurants from coast to coast—wage and hour violations are the most common workplace infractions.[xxxii]
Endnotes
[1] Table 1 shows median wages below the Santa Fe minimum wage for two occupations: hosts and hostesses, and hairdressers. As noted in the Table, these wage estimates are the result of the methodology used. Thus, for all intents and purposes, the typical wage for these occupations can be assumed to be the full applicable local minimum wage.
[i] Alan Webber, “Update the living wage and keep Santa Feans in Santa Fe,” Santa Fe New Mexican, August 23, 2025, https://www.santafenewmexican.com/opinion/my_view/update-the-living-wage-and-keep-santa-feans-in-santa-fe/article_064b7da7-b6a1-4bd1-a22e-410ec8179129.html.
[ii] “Spring 2025 Poll,” Yale Youth Poll, https://youthpoll.yale.edu/spring-2025-results. Accessed September 11, 2025. Relevant toplines: https://docs.google.com/spreadsheets/d/1JhSWPVcKK6tdufsa52TeRk3JRwSsgtglVQP1ZAa8fg4/edit?gid=507604013#gid=507604013.
[iii] Brian Burton, “A Majority of Voters Are Not Seeing Job Creation in the U.S. Economy and Think Available Jobs Are Not Good-Paying,” Data for Progress, July 25, 2025, https://www.dataforprogress.org/blog/2025/7/25/a-majority-of-voters-are-not-seeing-job-creation-in-the-us-economy-and-think-available-jobs-are-not-good-paying.
[iv] Anthony Salvanto, “CBS News Poll Finds Americans Describe ‘Uncertain’ Economy as its Ratings Tick Slightly Back Down,” September 3, 2025, https://www.cbsnews.com/news/cbs-news-poll-economy-ratings-uncertain-03-09-2025/.
[v] Lindsay Ellis and Aaron Zitner, “Americans Lose Faith That Hard Work Leads to Economic Gains, WSJ-NORC Poll Finds,” Wall Street Journal, September 1, 2025, https://www.wsj.com/economy/wsj-norc-economic-poll-73bce003.
[vi] NELP analysis of U.S. Bureau of Labor Statistics, May 2024 Metropolitan and Nonmetropolitan Area Occupational Employment and Wage Estimates.
[vii] U.S. Bureau of Labor Statistics, Occupational Employment and Wage Statistics, Frequently Asked Questions, “How are ‘wages’ defined by the OEWS survey?”, https://www.bls.gov/oes/oes_ques.htm. Accessed on September 5, 2025.
[viii] Living wage data sourced from the Living Wage Institute via https://livingwage.mit.edumetros/42140. Accessed on September 5, 2025.
[ix] “Minimum Wage,” City of Flagstaff, Arizona, https://www.flagstaff.az.gov/3520/Minimum-Wage. Accessed September 9, 2025.
[x] https://codelibrary.amlegal.com/codes/chicago/latest/chicago_il/0-0-0-2639835#JD_6-105-030.
[xi] Sylvia Allegretto and David Cooper, “Twenty-Three Years and Still Waiting for Change,” Economic Policy Institute, July 10, 2014, http://www.epi.org/files/2014/EPI-CWED-BP379.pdf.
[xii] Ibid.
[xiii] Ibid.
[xiv] NELP analysis of Current Employment Statistics survey, 2015-2024.
[xv] https://library.municode.com/nm/santa_fe/codes/code_of_ordinances?nodeId=CHXXVIIIWARE_28-1LIWA_28-1.5MIWAPARE.
[xvi] https://www.santafecountynm.gov/documents/ordinances/Ordinance2014-1.pdf.
[xvii] https://www.dws.state.nm.us/Minimum-Wage-Information.
[xviii] Rebecca Dixon, “From Excluded to Essential: Tracing the Racist Exclusion of Farmworkers, Domestic Workers, and Tipped Workers from the Fair Labor Standards Act” [testimony], National Employment Law Project, May 3, 2021, https://www.nelp.org/app/uploads/2021/05/NELP-Testimony-FLSA-May-2021.pdf.
[xix] NELP analysis of American Community Survey 1-Year Estimates, Public Use Microdata Sample (2023), Santa Fe County, New Mexico.
[xx] Ibid.
[xxi] Jocelyn Frye, “Not Just the Rich and Famous: The Pervasiveness of Sexual Harassment Across Industries Affects All Workers,” Center for American Progress, Nov. 20, 2017, https://www.americanprogress.org/article/not-just-rich-famous/. See also “The Glass Floor: Sexual Harassment in the Restaurant Industry,” Restaurant Opportunities Center United and Forward Together, October 7, 2014, https://onlabor.org/wp-content/uploads/2016/04/REPORT_TheGlassFloor_Sexual-Harassment-in-the-Restaurant-Industry.pdf .
[xxii] Catharine MacKinnon and Louise Fitzgerald, “The Tipping Point: How the Subminimum Wage Keeps Incomes Low and Harassment High,” One Fair Wage, March 2021, https://static1.squarespace.com/static/6374f6bf33b7675afa750d48/t/6478bd83b18a89504f4bdaf0/1685634436858/OFW_TheTippingPoint_3-1.pdf.
[xxiii] Michael Lynn, Determinant and Consequences of Female Attractiveness and Sexiness: Realistic Tests with Restaurant Waitresses, Cornell University, School of Hotel Administration, https://ecommons.cornell.edu/server/api/core/bitstreams/fe264758-44eb-4a1f-8ab5-a3358e0cf338/content. Accessed September 6, 2025.
[xxiv] Allegretto and Cooper, op. cit.
[xxv] “State of the Restaurant Industry 2024,” National Restaurant Association, https://go.restaurant.org/rs/078-ZLA-461/images/2024-soi-pocketbook.pdf?version=0.
[xxvi] “State of the Restaurant Industry 2025,” National Restaurant Association, https://restaurant.org/research-and-media/research/research-reports/state-of-the-industry/.
[xxvii] Ibid.
[xxviii] “State of the Restaurant Industry 2024,” op. cit.
[xxix] Allegretto and Cooper, op. cit.
[xxx] “Unlivable: Increased Sexual Harassment and Wage Theft Continue to Drive Women, Women of Color, and Single Mothers Out of the Service Sector,” One Fair Wage, April 2022, https://static1.squarespace.com/static/6374f6bf33b7675afa750d48/t/6478be7db18a89504f4bff49/1685634685485/OFW_Unlivable.pdf.
[xxxi] Philip Mattera, “Grand Theft Paycheck: The Large Corporations Shortchanging their Workers’ Wages,” Good Jobs First, June 2018, https://goodjobsfirst.org/wp-content/uploads/docs/pdfs/wagetheft_report_revised.pdf. See Table 7.
[xxxii] See for example, Good Jobs First analyses of violation cases brought up against Brinker International, which owns Chili’s Grill & Bar restaurants (https://violationtracker.goodjobsfirst.org/?parent=brinker-international); Dine Brands Global , which operates franchised and corporate owned restaurants including Applebee’s Neighborhood Grill & Bar and International House of Pancakes (https://violationtracker.goodjobsfirst.org/?parent=dine-brands-global); Dave and Buster’s Entertainment Inc., which owns and operates eponymous restaurants (https://violationtracker.goodjobsfirst.org/parent/dave-and-busters-entertainment-inc); Cheesecake Factory, which operates over 300 restaurants (https://violationtracker.goodjobsfirst.org/parent/cheesecake-factory); and the largest restaurant group, Darden Restaurants, which operates more than 1,800 restaurants, including Olive Garden, LongHorn Steakhouse, Ruth’s Chris Steak House, and The Capital Grille (https://violationtracker.goodjobsfirst.org/?parent=darden-restaurants).
Related to
About the Author

Yannet Lathrop
Areas of expertise:
- Living Wage & Minimum Wage