On March 6, the Bureau of Labor Statistics delivered a particularly gloomy jobs report with employers cutting 92,000 jobs in February alone. Even before the war on Iran, the February jobs data dashed hopes that the start of 2026 would deliver a turnaround in the job market. With February’s decline and downward revisions for both December and January, the number of people with jobs has been stuck in neutral for nearly a year (158.4 million in April 2025 and in February 2026). Meanwhile, the number of unemployed workers jumped by nearly 700,000 from January 2025 (6.87 million) to February 2026 (7.57 million).
Despite the increased job losses, unemployment claims have not spiked upwards, and that has as much to do with the failings of the current UI system as with the state of the economy. As of the week ending February 28, there were 1.85 million people on state unemployment benefits (not including 12,500 on federal benefits). While that is up from a low of 1.819 million in January, it is essentially the same as this time last year (1.851 million), New unemployment claims dipped to 213,000 for the week ending March 7, after two straight weeks of being unchanged at below average levels, and are actually less than they were this time last year (223,000).
The state-by-state data reveals a major reason why claims have not risen as more people have lost work. Unemployment insurance rules and procedures vary widely by state. States set the maximum weekly unemployment benefit level, which is as high as $1,152 per week in Washington state and as low as $235 per week in Mississippi. Most states offer up to 26 weeks of benefits, but states like Florida and Arkansas offer only 12 weeks. Some states have rules that screen out part-time workers and those who are forced to quit work due to issues like illness or child care—restrictions that fall heavily on women and people of color.
To be effective, a UI program should be responsive to changes in job loss, with claims going up when the economy goes down, and benefits effectively cushioning families and the economy from the effects of joblessness. There are a lot of factors affecting how responsive the system is including the technology and customer experience, the eligibility rules, and the amount of benefits themselves. Last year provided a real test of responsiveness—giving us the ability to judge which states were more or less responsive to rising unemployment. Table 1 ranks states by their change in unemployment rate through December 2025 (the latest available data). The six states with the biggest increases in their unemployment rates over the last year (Delaware, DC, Maryland, Minnesota, Connecticut, and Oregon) also logged an increase in the number of people on unemployment benefits. Oregon, DC, and Massachusetts stand out as states with that were particularly responsive last year, with unemployment claims increasing by more than 10 percent as their labor markets declined. Among all states, Virginia had the largest one-year increase in unemployment claims as federal layoffs contributed to a large 27 percent increase in residents collecting in the Commonwealth (a change that inspired the legislature to vote to raise benefits by $48 per week). In contrast, while Florida’s unemployment rate increased from 3.4 percent to 4.3 percent over 2025, the number of people that applied and became eligible for UI benefits declined by 12.8 percent. Similarly, the unemployment rate in Arkansas, West Virginia, and Arizona all increased by more than a half percentage point, but the number of people eligible for and collecting UI benefits declined by more than 20 percent over the year.
View Table: Change in Unemployment and Unemployment Insurance by State
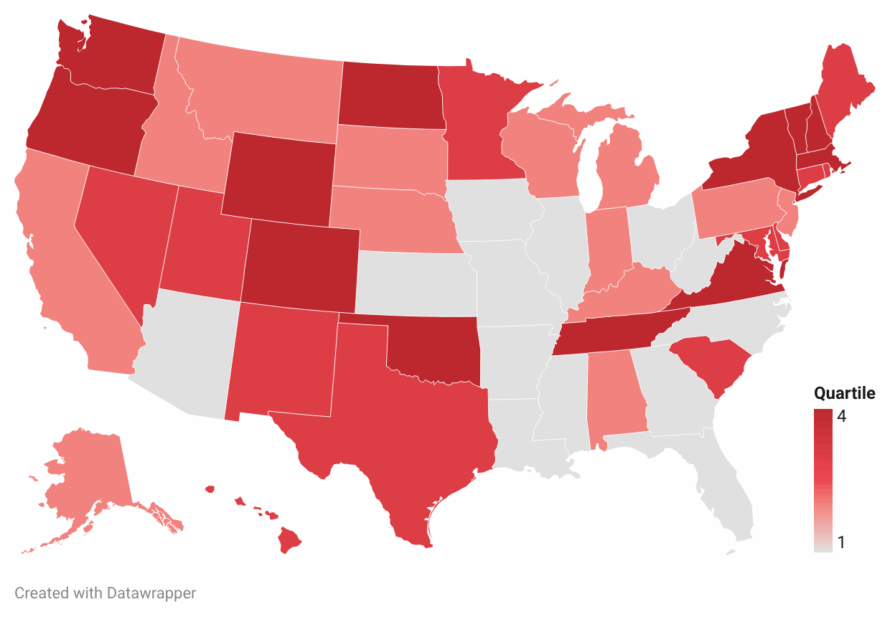
Mapping this data reveals clear geographic patterns in unemployment claims over the past year. To spotlight the differences, this map puts the states in four quartiles based on the increase in continued claims from January 2025 to January 2026 (with the darkest 4th quartile representing the biggest increase). States in the Northwest, Mid-Atlantic, and Northeast (and part of the Rocky Mountain/Plains region like Colorado and North Dakota) have exhibited the most significant uptick in unemployment benefits. In contrast, Southeast and lower Midwest states (Ohio, Iowa, Illinois, Missouri) have seen declines in unemployment recipients even as hiring has slowed. Measured by an increase in unemployment insurance eligibility, these Southeast and Midwest states were less up to the challenge of a slowing job market than those in other regions of the country.
Increase In People Receiving Unemployment Benefits (2025-2026) By Quartile
The true test of unemployment systems would come with an economic calamity like a COVID pandemic or a recession that could accelerate AI-related job displacement. Nevertheless, the experience over the past year is a window into how ready state unemployment programs are for the challenge of increasing unemployment. Many states appear to be failing the basic test of paying out benefits when a single person needs benefits, let alone many during an economic downturn. At a time when finding a job is much harder than the unemployment rate reveals, unemployment benefits help families afford the rising prices of food and gas while they undergo the tough search for their next job. As we contemplate potential AI job displacements, the inadequacy of some state programs becomes more grave. That’s why Congress has frequently stepped in with additional unemployment benefits to fill the gaps in these state safety nets. The absence of that aid has been felt over the past year, and it is unclear what actions Congress would take if new economic threats like the war on Iran were to tip the economy into recession.

| Delaware | 1.8% | 1.6 |
|---|---|---|
| District of Columbia | 11.8% | 1.4 |
| Maryland | 5.8% | 1.1 |
| Minnesota | 1.6% | 1.1 |
| Connecticut | 2.5% | 1 |
| Oregon | 17.9% | 0.9 |
| Florida | -12.8% | 0.9 |
| New Jersey | -1.9% | 0.8 |
| Massachusetts | 13.5% | 0.7 |
| Virginia | 27.1% | 0.7 |
| Arkansas | -26.4% | 0.6 |
| Arizona | -22.7% | 0.5 |
| Montana | -1.6% | 0.5 |
| Pennsylvania | -3.7% | 0.5 |
| West Virginia | -20.3% | 0.5 |
| South Carolina | 1.6% | 0.4 |
| New Hampshire | 10.1% | 0.3 |
| Oklahoma | 9.8% | 0.3 |
| South Dakota | -0.7% | 0.3 |
| Utah | 4.7% | 0.3 |
| Missouri | -11.4% | 0.3 |
| Puerto Rico | 1.8% | 0.3 |
| Washington | 12.1% | 0.3 |
| Iowa | -12.6% | 0.2 |
| North Carolina | -27.4% | 0.2 |
| New York | 12.1% | 0.2 |
| Mississippi | -8.4% | 0.1 |
| Nebraska | 0.9% | 0.1 |
| North Dakota | 6.8% | 0.1 |
| Vermont | 6.8% | 0.1 |
| Alaska | -1.9% | 0.1 |
| Texas | 3.0% | 0.1 |
| California | -5.9% | 0 |
| Georgia | -10.9% | 0 |
| Kansas | -16.0% | 0 |
| New Mexico | 1.6% | 0 |
| Ohio | -8.1% | 0 |
| Wisconsin | -4.4% | 0 |
| Tennessee | 8.2% | -0.1 |
| Wyoming | 5.9% | -0.1 |
| Idaho | -1.7% | -0.2 |
| Maine | 5.2% | -0.2 |
| Michigan | 0.0% | -0.2 |
| Rhode Island | 2.9% | -0.2 |
| Illinois | -6.4% | -0.3 |
| Louisiana | -39.3% | -0.4 |
| Alabama | -2.4% | -0.6 |
| Nevada | 5.4% | -0.6 |
| Colorado | 8.8% | -0.8 |
| Hawaii | 2.9% | -0.8 |
| Kentucky | -0.4% | -0.8 |
| Indiana | -5.7% | -0.9 |
Change in Unemployment and Unemployment Insurance by State (Year-over-Year Change). Change in continued state UI claims is measured as the average number from January 10-January 31, 2026, not seasonally adjusted, compared to the same period in the prior year. Change in state unemployment rates is measured as the change from December 2024 to December 2025, seasonally adjusted.
Related to
About the Author

Andrew Stettner
The Latest News
All newsMarch Jobs Report: Cold Comfort for Millions Locked Out of Opportunity by Trump’s Economy

News Release
February Jobs Report: Sharp Job Cuts Imperil Increasing Numbers of Long-Term Unemployed

News Release
New Trump Independent Contractor Rule Will Weaken Minimum Wage and Overtime Protections for Millions of Working People

News Release