Restaurant servers and bartenders could lose control of a large portion of their earnings, if a proposed rule change by the Trump Labor Department goes into effect.
The Department of Labor recently proposed rolling back an Obama-era rule that protects workers in tipped industries, including restaurant servers and bartenders, from having their tips taken away by their employers. Under the proposal, federal law would allow restaurant owners who pay their wait staff and bartenders as little as $7.25 per hour to confiscate and pocket all of the tips left by customers, without having to disclose to patrons what happens to tips.
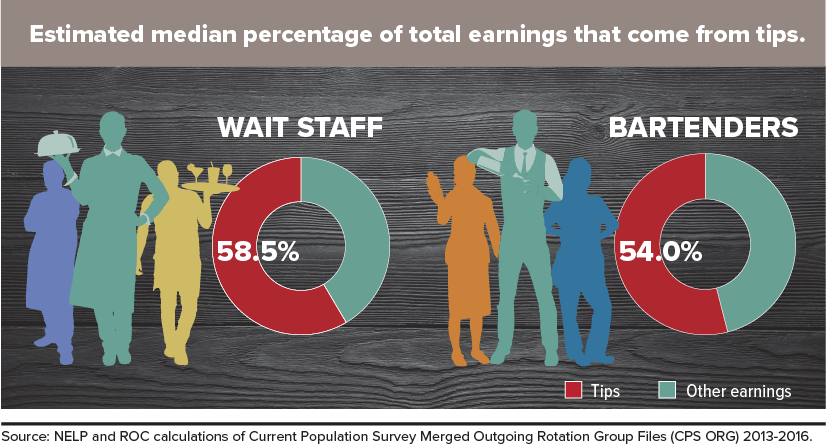
The Restaurant Opportunities Centers United (ROC) and the National Employment Law Project (NELP) examined the most recent public data available on wages for two commonly tipped occupations—waiters and bartenders—to determine just how much these restaurant workers depend on earnings from tips. The Census Bureau’s Current Population Survey (CPS), the primary government survey on wages, asks respondents to report their hourly wage, their usual hours, and their weekly earnings. From these data, we are able to estimate the share of total earnings that come from tips.
Servers Depend Heavily on Tips
Waiters and bartenders earn more in tips than they do from what employers pay them as an hourly base wage. The median share of hourly earnings that come from tips account for 58.5 percent of wait staff’s earnings, and 54 percent of bartenders’ earnings.
On a monthly basis, these tips add up. We found that the median monthly tip earnings for wait staff and bartenders are $867, suggesting that many of these workers depend on their tip earnings to pay for essential expenses such as rent and utilities.
Even with tips, workers in these occupations earn very little on an hourly and annual basis. A recent Economic Policy Institute and University of California-Berkeley study examining CPS data found that median hourly earnings for waiters and bartenders are a meager $10.11 per hour, including tips.1 That is just $2.86 above the current federal wage floor, and far below what workers throughout the country need to make ends meet.2
Workers of color make even less. Black workers in these occupations have a median hourly wage of $9.62, including tips, and Latino workers earn $9.93—suggesting that taking gratuities away from tipped workers will greatly impact workers of color and their families.3
On an annual basis, servers and bartenders have median earnings of $19,990 and $20,800, respectively, according to a Bureau of Labor Statistics survey of employers measuring employment and wages.4
If the proposal to rescind tip protections is adopted, most tipped workers would no longer control their tips as long as they earn the minimum wage. Employers would have incentive to pay only the federal minimum of $7.25 and then claim ownership of all tips.
The DOL suggests that business owners might use the tips to give workers more hours (at a lower effective wage) or to subsidize wages for “back-of-the-house” employees, but it acknowledges that employers can use the tips towards capital improvements or in any manner they see fit. A standard economic analysis found that $5.8 billion will be transferred from workers directly to employers as a result of this rule.5
The findings of our analysis are just a snapshot, but they suggest that the Trump administration’s proposed action could have a devastating effect on servers and their families.
Methodological Note
Our analysis uses data from the Current Population Survey (CPS), the primary government survey containing information on wages and hours. The CPS is a monthly national survey of approximately 60,000 households that is representative of the U.S. non-institutional population aged 16 and older. We used the Current Population Survey Merged Outgoing Rotation Groups (CPS ORG) files obtained from the Economic Policy Institute through the Economic Analysis and Research Network. In order to have a sample sufficiently large enough to analyze specific occupations and industries, our analysis combines data from the last four consecutive years available (2013-2016). We use earnings variables in which all values have been converted to 2016 dollars.
Our sample includes private and public sector hourly workers between the ages of 16 and 64. We exclude self-employed workers. We only include respondents for whom wage and occupation data are available. One data challenge is that the CPS combines earnings from tips with both overtime pay and earnings from commissions. We exclude a very small percentage of workers that report usual weekly hours above 40 hours because of the difficulty of separating overtime pay from tip earnings in the data. For workers reporting weekly hours of forty hours or less, we assume that they do not earn any overtime pay or commission.
Another major data limitation is that tip earnings are underreported in the CPS, with less than half of workers in our two target occupations reporting receiving any tips. Some of these respondents may have reported tips and base wages together as a lump sum. Others may have reported only their base wage and no tips.
For the purposes of generating estimates of the share of earnings represented by tips, we exclude respondents that did not report receiving any tips. As such, our analytic sample may skew towards higher earners. The mean and median weekly earnings of workers excluded from our sample—because they report no tips—are about 20 percent lower than those of workers included in our sample. The median hourly base wage for workers excluded from our sample because they report no tips is about 47 percent higher than that of those included in our sample, suggesting that some of these respondents did report base wages and tips together as one lump sum. However, because of the difficulty in determining the share of earnings represented by tips for these workers, we chose to exclude them from the analysis. To generate estimates on monthly tip earnings, we multiplied hourly tips by the usual number of weekly hours worked by 4.33. The estimates we report are reliable given the best and most recent public data available. Note that there is a tendency for workers to report hourly earnings in round numbers, which causes percentiles of the distribution to “clump” at whole-dollar values. Our analysis does not “smooth” wages to correct for this source of measurement error.
You can read the full publication below.
- Allegretto, Sylvia and Cooper, David, “Twenty-three Years and Still Waiting for Change: Why It’s Time to Give Tipped Workers the Regular Minimum Wage,” available at: http://irle.berkeley.edu/files/2014/Twenty-Three-Years-and-Still-Waiting-for-Change.pdf.
- National Employment Law Project, “Workers in All 50 States Will Need 15 by 2024,” available at: https://www.nelp.org/wp-content/uploads/workers-in-all-50-states-will-need-15-by-2024.pdf.
- See Allegretto and Cooper, note 1, supra.
- Bureau of Labor Statistics, Occupational Employment Statistics, May 2016, available at: https://www.bls.gov/oes/home.htm.
- Shierholz, Heidi, Cooper, David, Wolfe, Julia, and Zipperer, Ben, “Employers would pocket $6.1 billion of workers’ tips under Trump administration’s proposed “tip stealing” rule,” available at: http://www.epi.org/files/pdf/139138.pdf
Related to
About the Authors

Irene Tung
Areas of expertise:
- Research