Unemployment Insurance (UI) Benefit Amount Definitions
Average Weekly Benefit Amount: The average amount of money that workers receive each week in UI benefits.
Average Weekly Wage: The average amount of wage or salary compensation paid weekly to workers in positions covered by the UI system. Excluded from this average are the earnings of independent contractors and self-employed workers, who are not covered by the UI system, as well as the earnings of federal employees, who are covered by a separate unemployment system.
Base Period: The period of time (generally one year) used to determine whether unemployed workers have earned sufficient wages or worked enough hours (or both) to qualify for UI benefits and what amount of UI benefits they should receive. A worker’s base period is usually the first four of the last five completed quarters before the worker applied for UI benefits.
Maximum Benefit Amount: The most money a worker can legally receive each week in UI benefits in a given state. State laws determine the maximum and whether it is a fixed dollar amount or a proportion of the state’s average weekly wage.
Minimum Benefit Amount: The lowest amount of money a UI-eligible worker can legally collect each week in UI benefits. State laws determine the minimum and whether it is a fixed dollar amount or a proportion of the state’s average weekly wage.
Replacement Rate: The share of a worker’s previous wages that are replaced by UI benefit payments. Nationwide, UI replaces less than 40 percent of workers’ wages.
Overview
Unemployment insurance (UI) is designed to alleviate the economic hardship of losing a job by providing income to workers while they seek new employment. States pay eligible workers a weekly benefit based on their prior earnings. Yet average UI benefits across the nation replace less than 40 percent of workers’ previous wages,[1] providing too little support for many unemployed workers to make ends meet during a job search.
In many states, policymakers have set UI benefit levels so low that families fall into poverty when a worker becomes unemployed.[2] In Mississippi, for example, the average benefit in 2021 was less than $200 per week[3]—below the federal poverty line for even a single adult, much less a family.[4] And many workers receive less than the average benefit: Mississippi’s minimum benefit in 2021 was just $30 per week.[5]
State formulas for setting UI benefit amounts reinforce racial and gender inequality. States base UI benefit amounts on a worker’s previous pay, so women and workers of color, who are overrepresented in low-paying jobs due to structural racism and sexism, tend to receive lower benefits.[6] Tipped workers, who are also disproportionately women and people of color, are further disadvantaged when employers fail to report full tip amounts.[7] Low-paid workers who lived paycheck-to-paycheck cannot cover their expenses on benefits that are only a small a fraction of a paycheck.
Low benefits create greater hardship for Black workers and other workers of color because they typically have fewer other financial resources to draw on during unemployment. Racial wealth disparities are a result of systematic exclusion from wealth-building opportunities over generations.[8]
Average weekly UI benefit amounts vary widely by state. In 2021, the most generous state paid 2.73 times more than the least generous state.[9] The variation between states also reinforces racial inequity: Southern states, which have the greatest proportion of Black workers, and jurisdictions with a high proportion of Latinx workers tend to pay the lowest benefits.[10]
The wide variation in state benefit amounts does not reflect costs of living. Instead, it results from the methods and formulas state policymakers use to determine benefit amounts. The result is that unemployed workers in low-benefit states face greater difficulty affording basic expenses and making ends meet.
States determine benefit amounts
There are no federal standards for the amount of UI benefits states must pay. State policymakers select a method and formula for determining benefit amounts and decide how to set minimum and maximum benefits.
There are several methods that states use to determine a worker’s weekly benefit amount:
- High-quarter method: States determine UI benefit amounts based on the quarter in which the worker earned the most wages during their base period. This is the most common method, used by 22 states in 2021, plus DC, Puerto Rico, and the US Virgin Islands.[11] By looking at the highest-earning quarter, this method does the most, of methods currently in use, to protect workers with variable pay and hours.
- Multi-quarter method: States determine UI benefit amounts based on wages in multiple quarters during a worker’s base period. This method was used by 17 states in 2021.[12]
- Annual-wage method: States calculate UI benefit amounts as a percentage of a worker’s annual wages during their base period. This method, which can result in lower benefits for workers with variable earnings over the year, was used by six states in 2021.[13]
- Weekly-wage method: States calculate UI benefit amounts as a percentage of a worker’s average weekly wages during their base period. This method was used by seven states in 2021.[14]
Note that some states use a combination of methods to determine benefit amounts. See Table 3-5 in The Comparison of State Unemployment Insurance Laws for details on your state.
There is even more diversity in how states apply these methods. Each state uses a different formula to determine an individual worker’s benefit amount. Below are some examples of benefit formulas in states that provide the most adequate average UI benefit amounts to unemployed workers. Formulas were in use as of 2021. In all states, benefits are capped at the maximum benefit amount.
- Massachusetts: 50 percent of 1/26 of total wages from the two highest-earning quarters during the worker’s base period.[15] Massachusetts’s average weekly benefit amount in the first quarter of 2022 was $578.72.[16] UI benefits in Massachusetts replaced approximately 45 percent of the state’s average weekly wage.[17]
- Washington:85 percent of the average earnings from the two highest-earning quarters during the worker’s base period.[18] Washington’s average weekly benefit amount in the first quarter of 2022 was $568.82.[19] UI benefits in Washington replaced approximately 50 percent of the state’s average weekly wage.[20]
- New Jersey: 60 percent of the worker’s average weekly wage during their base period.[21] New Jersey’s average weekly benefit amount in the first quarter of 2022 was $518.10.[22] UI benefits in New Jersey replaced approximately 53 percent of the state’s average weekly wage.[23]
- Hawaii: 1/21 of wages from the highest-earning quarter during the worker’s base period.[24] Hawaii’s average weekly benefit amount in the first quarter of 2022 was $509.42.[25] UI benefits in Hawaii replaced approximately 56 percent of the state’s average weekly wage.[26]
- North Dakota: 1/65 of total wages from the two highest-earning quarters and 50 percent of total wages from the third highest-earning quarter during the worker’s base period.[27] North Dakota’s average weekly benefit amount in the first quarter of 2022 was $507.25.[28] UI benefits in North Dakota replaced approximately 50 percent of the state’s average weekly wage.[29]
States set minimum and maximum benefits
In addition to selecting a method and formula for determining each worker’s UI benefits, all states set minimum and maximum weekly benefits. Even if a worker was very highly paid, their weekly UI benefit cannot exceed the state’s maximum, and the lowest-paid workers who are eligible for UI will receive the state’s minimum benefit.
Thirty-three states (plus DC, Puerto Rico, and the US Virgin Islands) set their maximum benefits as a portion of the state’s average weekly wage.[30] This method of indexing the maximum weekly benefit amount allows benefits to grow in line with a state’s wage growth and to keep pace with increases in the cost of living. States that do not automatically adjust maximum benefits must rely on state legislatures to make adjustments, and they generally provide inadequate benefit amounts as a result. Indexing the minimum benefit amount to the state’s average weekly wage is less common (minimum benefits are indexed in eight states)[31] but is recommended for the same reasons.
Dependent allowance
As of 2021, 13 states offered dependent allowances to provide an additional weekly payment to unemployed workers supporting children or other dependents.[32] See our brief on dependent allowances at www.uipolicyhub.org for more details.
Higher benefit amounts during economic downturns
In 2020, when millions of people were unable to work due to COVID-19, Congress established Federal Pandemic Unemployment Compensation (FPUC), which provided a temporary $600 federal supplement to weekly unemployment benefits (later scaled back to $300). The UI supplement reduced poverty and financial hardship for unemployed workers and their families[33] and supported the consumer spending that sustained state and local economies.[34] Studies found that by sustaining spending, FPUC helped the economy recover more quickly from the pandemic recession.[35]
Workers’ experiences with the UI benefit supplement during the pandemic downturn highlight how inadequate regular state UI benefits are for enabling unemployed workers to make ends meet. FPUC also highlights the advantage of having the federal government step in to pay for supplemental benefits during economic downturns when unemployment rises substantially: states struggle most to pay for UI when the economy is weak, yet it is precisely during downturns when higher benefits can be a powerful force to stabilize the overall economy.
Federal Requirements and Guidance
There are currently no federal standards for UI benefit amounts. Strong federal standards for adequate benefit amounts would better enable unemployed workers across the country to support themselves and their families while looking for new work. At the same time, the current lack of federal guidance means that states must act to ensure their own UI benefit amounts are sufficient to support job seekers.
Policy Recommendations
By setting UI benefit amounts so low that unemployed workers fall into poverty, state policymakers undermine UI’s purpose of easing the economic hardship of job loss. To address this failure, the federal government should set standards to harmonize state benefit amounts at adequate levels and enact a progressive formula that replaces the greatest share of wages for the lowest-paid workers. The federal government should also pay for higher UI benefits during economic downturns.
In the absence of federal action, states should increase the amount of their own UI benefits and make the benefit formula more progressive.
States should:
- Reform UI benefit formulas to replace a higher proportion of wages.
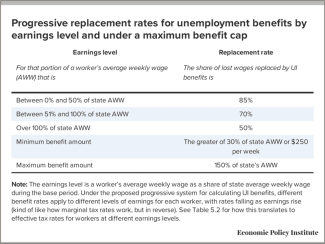
- Determine benefit amounts using a progressive formula that replaces at least 85 percent of wages for the lowest earners and gradually decreases to replace at least 50 percent of wages for the highest earners, up to a cap (the maximum benefit amount).
The chart below, drawn from a federal UI reform report by the National Employment Law Project, Economic Policy Institute, and other partners, details the proposed formula. For additional details on the proposal, see Reforming Unemployment Insurance, pp. 92–95. Given the substantial proportion of low-paid workers, disproportionately workers of color, who rely on the entirely of their paychecks to meet basic needs, states may also consider a benefit formula that replaces the entirety of wages for the lowest-paid workers. So far, no state has adopted a tiered formula that replaces a higher proportion of wages for low-paid workers.
- Alternatively, reform UI benefit methods and formulas in line with the states that currently provide the most adequate UI benefits. For example, Hawaii replaces 1/21 of the wages from the highest-earning quarter during the worker’s base period up to the maximum benefit amount.[36] This policy combines the high-quarter method that best protects workers who have variable pay and hours with a generous wage replacement formula, consistently resulting in some of the most adequate benefit levels and wage replacement rates in the nation.[37] Hawaii’s average weekly benefit amount in the first quarter of 2022 was $509.42,[38] and the state replaced approximately 56 percent of average wages.[39]
- Index minimum benefit amounts to the state’s average wage. Indexing ensures that benefits grow along with wages and that workers receiving the minimum benefit are provided with meaningful support.
- Set a minimum UI benefit amount of $250 per week or 30 percent of the state’s average weekly wage, whichever is greater. Currently no state sets minimum benefits at this level.
- Alternatively, set minimum UI benefits in line with the most adequate states. Montana’s minimum benefit is 20 percent of the state’s average weekly wage, amounting to $169 in 2021.[40] Oregon and Washington set their minimum benefits at 15 percent of their average weekly wage.
- Index maximum benefit amounts to the state’s average wage. Indexing the maximum weekly benefit amount, as most states already do, allows benefits to grow in line with a state’s wage growth and to keep pace with increases in the cost of living.
- Set a maximum benefit amount of 150 percent of the state’s average weekly wage. Currently no state sets maximum benefits at this level.
- Alternatively, set maximum UI benefits in line with the most adequate states. Hawaii sets its maximum benefit amount at 70 percent of the state’s average weekly wage, while several other states, including Arkansas, Montana, and West Virginia have set their maximum rate at between 66 and 67 percent of average wages.[41]
- Ensure fair benefit amounts for tipped workers and workers paid less than minimum wage. States should calculate benefit amounts for tipped workers, and other workers paid less than minimum wage, based on the relevant federal, state, or local minimum wage or, for tipped workers, self-reported wages with tips, whichever is greater. No states currently follow this practice, resulting in very low benefits for tipped and subminimum-wage workers who are eligible for UI benefits.
- Establish a dependent allowance. Dependent allowances provide an additional weekly payment to unemployed workers supporting children or other dependents. See our brief on dependent allowances at uipolicyhub.org for more on this policy recommendation.
Research Findings and Arguments to Support Reform
UI benefits are too low for workers to get by.
A core goal of UI is to alleviate the economic hardship of losing a job so workers have financial support as they seek new employment. Yet weekly benefits do not enable workers to make ends meet and in many cases are not even sufficient to prevent jobless workers and their families from falling into poverty.
In 2021, six states paid average weekly UI benefits (not including supplements from pandemic unemployment programs) lower than the approximately $248 per week needed to remain above the poverty line for even a single adult household (annual income of $12,880).[42] And in every state except one (Massachusetts), average weekly UI benefits were lower than the approximately $510 per week needed to remain above the poverty line for a four-person household (annual income of $26,500).[43]
Analysts have developed a variety of tools to estimate the true minimum cost of household necessities for different family sizes in different parts of the country, including the Economic Policy Institute’s Family Budget Calculator, the ALICE Household Survival Budget, and MIT’s Living Wage Calculator. In most cases, UI benefit amounts are not sufficient to afford the local cost of living.[44]
Workers trying to get by on unemployment benefits may particularly struggle to keep up with rent or mortgage payments. Average unemployment benefits nationally worked out to approximately $1,405 per month in 2021 (again not including pandemic UI supplements), yet the nation’s average fair market rent for a two-bedroom rental home was $1,295 per month.[45] Unemployed workers trying to pay rent for an average home using the average unemployment benefit amount would face a severe housing cost burden[46] and lack sufficient resources to pay for food, utilities, and other necessities and financial obligations without falling behind on rent.
UI benefits fail to replace a sufficient share of workers’ pay.
In the 1990s, the bipartisan Advisory Council on Unemployment Insurance Compensation recommended that “a state’s weekly benefit amount should replace at least one-half of a worker’s prior weekly wage for a six-month period, with a maximum weekly benefit amount equal to at least two-thirds of a state’s prior year’s average weekly wage.”[47] While this standard falls short of what low-paid workers living paycheck-to-paycheck need to avoid severe hardship, many states still fail to meet even this guideline. On average, state unemployment benefits replaced less than 40 percent of wages in 2021.[48]
UI benefits are even more inadequate at replacing compensation than it appears—because they only replace a portion of wages, they do nothing to replace other vital job benefits that some workers may also lose when they become unemployed, such as employer contributions to health coverage, childcare, and retirement savings.
Formulas for setting benefit amounts reinforce racial and gender inequality.
The system of calculating UI benefit amounts reinforces inequality, particularly disadvantaging women and workers of color. Women, Black and Latinx workers, and other workers of color are disproportionately employed in low-paying jobs as a result of occupational segregation.[49] Since unemployment benefits are based on a percentage of a worker’s pay prior to becoming unemployed, lower-paid workers receive lower benefits than workers who were more highly paid.
Racial disparities in UI benefit amounts are further worsened because Southern states, where a majority of Black workers live, have established benefit formulas that pay the lowest benefits in the nation. For example, Mississippi and Louisiana, the US states with the highest proportion of Black residents,[50] paid the nation’s lowest average weekly unemployment benefits in the third quarter of 2021: $180.99 per week in Louisiana and $201.22 in Mississippi, compared to a still-inadequate national average of $347.53 per week.[51] This is not only due to lower wages in these states—low-benefit states like Mississippi and Louisiana replace a lower proportion of workers’ weekly pay,[52] and it falls far short of the local cost of living.[53]
Jurisdictions with large Latinx populations, including Puerto Rico (average weekly benefit $195.61) and Arizona (average weekly benefit $235.92), also paid among the lowest benefits in the nation.[54]
Low UI benefits are also more likely to create severe hardship for Black and Latinx workers. When benefits are not enough to cover household expenses, workers may draw on savings or other forms of wealth to pay for groceries and rent. Yet the median Black or Latinx household has far less personal wealth than the median white household to cushion the impact of unemployment: for every dollar in wealth held by the typical white family, the typical Black family has just 12 cents, while the typical Latinx family has 21 cents.[55] Racial wealth inequality is a result of decades of public policy that systematically excluded Black and Latinx households from wealth-building opportunities over generations.[56] When workers are forced to take on debt to meet basic living expenses during periods of unemployment, it further exacerbates this inequity.
Increasing benefit amounts supports local businesses and state economies.
When unemployed workers receive adequate UI benefits, they can take the time they need to find appropriate jobs that use their skills without being forced to accept the first job that comes along out of desperation. As a result, businesses find better workers, and improved job matching enhances the functioning of the labor market overall, contributing to economic growth and vitality.[57]
UI benefits are even more important for the economy during recessions and other periods of downturn, such as when mass layoffs at a large employer send a town or region into an economic tailspin. When the economy slows down and unemployment rises, decreased consumer spending is a major obstacle to economic recovery.[58] UI benefits are one of the most efficient and well-targeted means of economic stimulus: economists find that a $100 increase in government spending on UI leads to $70-$90 in additional economic growth in the private sector.[59] UI gets money into the hands of consumers who need it and will spend it quickly, supporting businesses in their communities and stabilizing the state’s economy.
States can afford to raise benefit amounts.
States can raise substantial revenue for improving UI benefit amounts by updating UI financing, including broadening the taxable wage base and preventing businesses from dodging UI taxes. See our brief on state UI financing and solvency at www.uipolicyhub.org for more on these policy recommendations.
Data and State Comparison Resources
Find your state’s minimum and maximum UI benefit amounts and methods of calculation and compare with other states.
Consult the US Department of Labor’s (USDOL) annual Comparison of State Unemployment Insurance Laws for a detailed comparisons of states’ benefit amounts and methods of calculating them, including:
- The state’s formula for calculating weekly benefit amounts (Table 3-5)
- The state’s minimum and maximum weekly benefit amounts (Table 3-5)
- How minimum and maximum weekly benefit amounts are calculated in states that automatically adjust them based on changes in the state’s average weekly wage (Table 3-6)
For an overview chart of key statistics on state UI programs, including quick comparisons of each state’s minimum and maximum weekly benefit amounts and formulas for calculating them, see USDOL’s annual Significant Provisions of UI State Laws. Both of these resources are updated annually, so table references may change.
Find average weekly benefits paid by your state and compare with other states and the nation.
Consult USDOL’s Monthly Program and Financial Data reporting tool, which allows users to look up select UI data, including a state’s average weekly benefit by state and month.
Calculate the percentage of average wages that are replaced by UI benefits in your state and compare with other states.
Consult USDOL’s UI Replacement Rates reporting tool, which allows users to look up annual or quarterly data on the proportion of wages replaced by UI benefits in each state and the nation. The reporting tool provides two different calculations for replacement rates (called “replacement ratios”), which are explained on the site. Note that the source of this data is different from the source for other UI data, so numbers for average weekly benefits may differ slightly.[60]
See also the Century Foundation’s Unemployment Insurance Dashboard for maps comparing states by replacement rate and maximum weekly benefit amount.
Determine whether average benefits in your state are enough to keep a family out of poverty.
After finding your state’s average benefit amounts using the resources above, check them against federal poverty guidelines for the relevant year, available from the US Department of Health and Human Services. Since federal poverty guidelines provide an annual number, divide by 52.14 (the number of weeks in a year) to determine the weekly amount a family needs to remain above the poverty line.
Determine whether average benefits in your state are enough to afford the local cost of living.
Analysts have developed a variety of tools to estimate the true minimum cost of household necessities for different family types in different parts of the country. The Economic Policy Institute’s Family Budget Calculator, the ALICE Household Survival Budget, and MIT’s Living Wage Calculator are user-friendly web applications that allow advocates to determine the state or local cost of living. Each uses a slightly different methodology—take a look to see which best suits you. After finding your state’s average benefit amounts using the resources above, check them against one of these tools to assess whether average UI benefits are sufficient to afford the local cost of living and determine what would be needed to adequately support unemployed workers and their families.
Determine whether average benefits in your state are enough to pay rent on a typical apartment in your state or metro area.
After finding your state’s average benefits using the resources above, consult the National Low Income Housing Coalition’s annual Out of Reach report for information on the income needed to afford a modest apartment in your area.
Compare benefit adequacy by state.
Consult the annual Comparison of State Benefit Adequacy and Recipiency report from Center for Research on Unemployment Insurance Systems for a state-by-state look at a range of benefit amount metrics. For example, the report compares each state’s average weekly benefit amount to its minimum wage and an estimated weekly benefit amount. The report also details each state’s UI replacement rate for four representative workers claiming UI benefits. Note that the most recent report available as of this publication is from 2022.
References and Essential Articles
Josh Bivens et al., Reforming Unemployment Insurance: Section 5 Benefit Levels, Center for American Progress, Center for Popular Democracy, Economic Policy Institute, Groundwork Collaborative, National Employment Law Project, National Women’s Law Center, and Washington Center for Equitable Growth, July 2021, https://s27147.pcdn.co/wp-content/uploads/Reforming-Unemployment-Insurance-June-2021.pdf.
Alix Gould-Werth, Research on Race and Consumption Shows Why Racial Disparities in Unemployment Insurance Receipt are Detrimental to Economic Recovery in the United States, Washington Center for Equitable Growth, March 1, 2021, https://equitablegrowth.org/research-on-race-and-consumption-shows-why-racial-disparities-in-unemployment-insurance-receipt-are-detrimental-to-economic-recovery-in-the-united-states/.
Michele Evermore, Unemployment Benefit Amounts Must Be High Enough To Sustain Workers In This Crisis, National Employment Law Project, April 27, 2020, https://www.nelp.org/blog/unemployment-benefit-amounts-must-be-high-enough-to-sustain-workers-in-this-crisis/.
Robert Pavosevich, Unemployment Insurance: Comparison of State Benefit Adequacy and Recipiency 2020, Center for Research on Unemployment Insurance Systems, June 2021, https://uidatage.com/wp-content/uploads/2022/02/2020comparisonofstatebenefitadequacyrecipiency.pdf.
Lily Roberts and Justin Schweitzer, You Can’t Afford to Live Anywhere in the United States Solely on Unemployment Insurance, Center for American Progress, September 10, 2020, https://www.americanprogress.org/article/cant-afford-live-anywhere-united-states-solely-unemployment-insurance/.
Amy Traub and Kim Diehl, Reforming Unemployment Insurance Is a Racial Justice Imperative, National Employment Law Project, February 28, 2022, https://www.nelp.org/publication/reforming-unemployment-insurance-is-a-racial-justice-imperative/.
Endnotes
[1] “UI Replacement Rates Report,” US Department of Labor Employment and Training Administration, https://oui.doleta.gov/unemploy/ui_replacement_rates.asp.
[2] A. Nicole Clowers, “COVID-19: Urgent Actions Needed to Better Ensure an Effective Federal Response,” US Government Accountability Office, November 2020, https://www.gao.gov/assets/gao-21-191.pdf.
[3] “Unemployment Insurance Data,” US Department of Labor Employment and Training Administration, https://oui.doleta.gov/unemploy/data_summary/DataSum.asp.
[4] “2021 Poverty Guidelines,” US Department of Health and Human Services, 2021, https://aspe.hhs.gov/topics/poverty-economic-mobility/poverty-guidelines/prior-hhs-poverty-guidelines-federal-register-references/2021-poverty-guidelines.
[5] “Comparison of State Unemployment Insurance Laws 2021,” US Department of Labor, 2021, 73, https://oui.doleta.gov/unemploy/pdf/uilawcompar/2021/complete.pdf.
[6] Jasmine Tucker and Julie Vogtman, “When Hard Work Is Not Enough: Women In Low-Paid Jobs,” National Women’s Law Center, April 2020, https://nwlc.org/wp-content/uploads/2020/04/Women-in-Low-Paid-Jobs-report_pp04-FINAL-4.2.pdf.
[7] Michael E. McKenney, “Billions in Tip-Related Tax Noncompliance Are Not Fully Addressed and Tip Agreements Are Generally Not Enforced,” Treasury Inspector General for Tax Administration, September 28, 2018, https://www.treasury.gov/tigta/auditreports/2018reports/201830081fr.pdf.
[8] Angela Hanks, Danyelle Solomon, and Christian E. Weller, “Systemic Inequality,” Center for American Progress, February 21, 2018, https://www.americanprogress.org/article/systematic-inequality/.
[9] In 2021, the most generous state was Massachusetts, which paid an average UI benefit of $508 per week, and the least generous state was Louisiana, which paid an average UI benefit of $186 per week. “Monthly Program and Financial Data,” US Department of Labor Employment and Training Administration, https://oui.doleta.gov/unemploy/claimssum.asp.
[10] Amy Traub and Kim Diehl, “Reforming Unemployment Insurance Is a Racial Justice Imperative,” National Employment Law Project, February 2022, https://www.nelp.org/publication/reforming-unemployment-insurance-is-a-racial-justice-imperative/.
[11] AZ, CA, CO, CT, DC, FL, HI, ID, IA, KS, MD, MI, MN, MS, NV, NY, OK, PA, PR, SD, TX, UT, VI, WI, and WY. “Comparison of State Unemployment Insurance Laws 2021.”
[12] AL, AR, DE, GA, IL, LA, ME, MA, MO, MT, NC, ND, RI, TN, VT, VA, and WA. “Comparison of State Unemployment Insurance Laws 2021.”
[13] AK, KY, MT, NH, OR, and WV. “Comparison of State Unemployment Insurance Laws 2021.”
[14] IN, MN, NE, NJ, NM, OH, and SC. “Comparison of State Unemployment Insurance Laws 2021.”
[15] “Comparison of State Unemployment Insurance Laws 2021.”
[16] “Unemployment Insurance Data.”
[17] “UI Replacement Rates Report.”
[18] “Comparison of State Unemployment Insurance Laws 2021.”
[19] “Unemployment Insurance Data.”
[20] “UI Replacement Rates Report.”
[21] “Comparison of State Unemployment Insurance Laws 2021.”
[22] “Unemployment Insurance Data.”
[23] “UI Replacement Rates Report.”
[24] “Comparison of State Unemployment Insurance Laws 2021.”
[25] “Unemployment Insurance Data.”
[26] “UI Replacement Rates Report.”
[27] “Comparison of State Unemployment Insurance Laws 2021.”
[28] “Unemployment Insurance Data.”
[29] “UI Replacement Rates Report.”
[30] AR, CO, CT, DC, HI, ID, IL, IA, KS, KY, LA, ME, MA, MN, MT, NE, NV, NJ, NM, NC, ND, OH, OK, OR, PA, PR, RI, SC, SD, TX, UT, VT, VI, WA, WV, and WY. “Comparison of State Unemployment Insurance Laws 2021.”
[31] AR, KS, MT, NM, OR, TX, WA, and WY. “Comparison of State Unemployment Insurance Laws 2021.”
[32] AK, CT, IL, IA, ME, MD, MA, MI, NJ, NM, OH, PA, and RI. “Comparison of State Unemployment Insurance Laws 2021.”
[33] “Did Unemployment Insurance Lower Official Poverty Rates in 2020?,” US Census Bureau, September 14, 2021, https://www.census.gov/library/stories/2021/09/did-unemployment-insurance-lower-official-poverty-rates-in-2020.html.
[34] Anil Kumar, “Pandemic Unemployment Benefits Provided Much Needed Fiscal Support,” Federal Reserve Bank of Dallas, 2020, https://www.dallasfed.org/research/swe/2020/swe2004/swe2004c.aspx.
[35] Peter Ganong et al., “Spending and Job Search Impacts of Expanded Unemployment Benefits: Evidence from Administrative Micro Data,” Becker Friedman Institute for Economics, July 2022, https://bfi.uchicago.edu/wp-content/uploads/2021/02/BFI_WP_2021-19.pdf.
[36] Hawaii’s benefit formula was changed from 1/25 of high quarter wages to 1/21 of high quarter wages in 1992 for the explicit purpose of restoring the “lost purchasing power” of unemployed workers. There is no clear rationale behind the 1/21 formula beyond producing higher benefit amounts. Haw. Rev. Stat. Ann. §383-22(b) https://www.capitol.hawaii.gov/hrscurrent/Vol07_Ch0346-0398/HRS0383/HRS_0383-0022.htm.
[37] “UI Replacement Rates Report.”
[38] “Unemployment Insurance Data.”
[39] “UI Replacement Rates Report.”
[40] “Comparison of State Unemployment Insurance Laws 2021.”
[41] Id., 76–77.
[42] “2021 Poverty Guidelines.”
[43] Id.
[44] “EPI Family Budget Calculator,” Economic Policy Institute, 2022, https://www.epi.org/resources/budget/; “United for ALICE Wage Tool,” United Way of Northern New Jersey, 2022, https://www.unitedforalice.org/wage-tool; Amy K. Glasmeier, “Living Wage Calculator,” Massachusetts Institute of Technology, 2022, https://livingwage.mit.edu/.
[45] Andrew Aurand et al., “Out of Reach: The High Cost of Housing,” National Low Income Housing Coalition, 2021, https://nlihc.org/sites/default/files/oor/2021/Out-of-Reach_2021.pdf.
[46] According to the National Low Income Housing Coalition, “households are considered housing cost burdened if they spend more than 30 percent of their income on housing costs, which includes rent and utilities. They are considered severely cost burdened if they spend more than 50 percent of their income on housing costs.” “Out of Reach: The High Cost of Housing.”
[47] “Collected Findings and Recommendations: 1994-1966,“ Advisory Council on Unemployment Compensation, 1996, https://oui.doleta.gov/dmstree/misc_papers/advisory/acuc/collected_findings/adv_council_94-96.pdf
[48] Based on USDOL’s Replacement Ratio 2, “UI Replacement Rates Report.”
[49] Tucker and Vogtman, “When Hard Work is Not Enough.”
[50] “Did Unemployment Insurance Lower Official Poverty Rates in 2020?”
[51] “Unemployment Insurance Data.”
[52] “Comparison of State Unemployment Insurance Laws,” 72.
[53] “EPI Family Budget Calculator,” Economic Policy Institute, 2022, https://www.epi.org/resources/budget/; “United for ALICE Wage Tool,” United Way of Northern New Jersey, 2022, https://www.unitedforalice.org/wage-tool; Amy K. Glasmeier, “Living Wage Calculator,” Massachusetts Institute of Technology, 2022, https://livingwage.mit.edu/.
[54] “Unemployment Insurance Data.”
[55] Ana Hernandez Kent and Lowell Ricketts, “Wealth Gaps between White, Black and Hispanic Families in 2019,” Federal Reserve Bank of St. Louis, 2021, https://www.stlouisfed.org/on-the-economy/2021/january/wealth-gaps-white-black-hispanic-families-2019.
[56] Hanks, Solomon, and Weller, “Systemic Inequality.”
[57] Ammar Farooq, Adriana D. Kugler, and Umberto Muratori, “Do Unemployment Insurance Benefits Improve Match Quality? Evidence From Recent U.S. Recessions,” National Bureau of Economic Research, July 2020, https://www.nber.org/system/files/working_papers/w27574/revisions/w27574.rev0.pdf.
[58] “Policy Basics: Fiscal Stimulus,” Center on Budget and Policy Priorities, May 2020, https://www.cbpp.org/research/economy/fiscal-stimulus.
[59] Gabriel Chodorow-Reich, “Geographic Cross-Sectional Fiscal Spending Multipliers: What Have We Learned?,” National Bureau of Economic Research, 2017, https://www.nber.org/papers/w23577; Marco Di Maggio and Amir Kermani, “The Importance of Unemployment Insurance as an Automatic Stabilizer,” National Bureau of Economic Research, 2016, https://www.nber.org/papers/w22625.
[60] The UI Replacement Rates reporting tool uses Benefit Accuracy Measurement data, which is drawn from a sample of UI claims rather than full claims data.
Related to
Related Resources
All resourcesWhy Women Need a Stronger Unemployment Insurance System

Policy & Data Brief
NELP’s New York City Worker Justice Agenda

Policy & Data Brief
Why Lawmakers Must Remove the Labor Dispute Disqualification from Unemployment Insurance

Policy & Data Brief