Introduction & Summary
Across the nation, Americans are working harder and producing more but still struggling to get by.[i] Despite low unemployment rates, many workers increasingly feel like the economy is not working for them, with growing inequality, stagnant wages, and even declining life expectancy fueling economic anxiety.[ii]
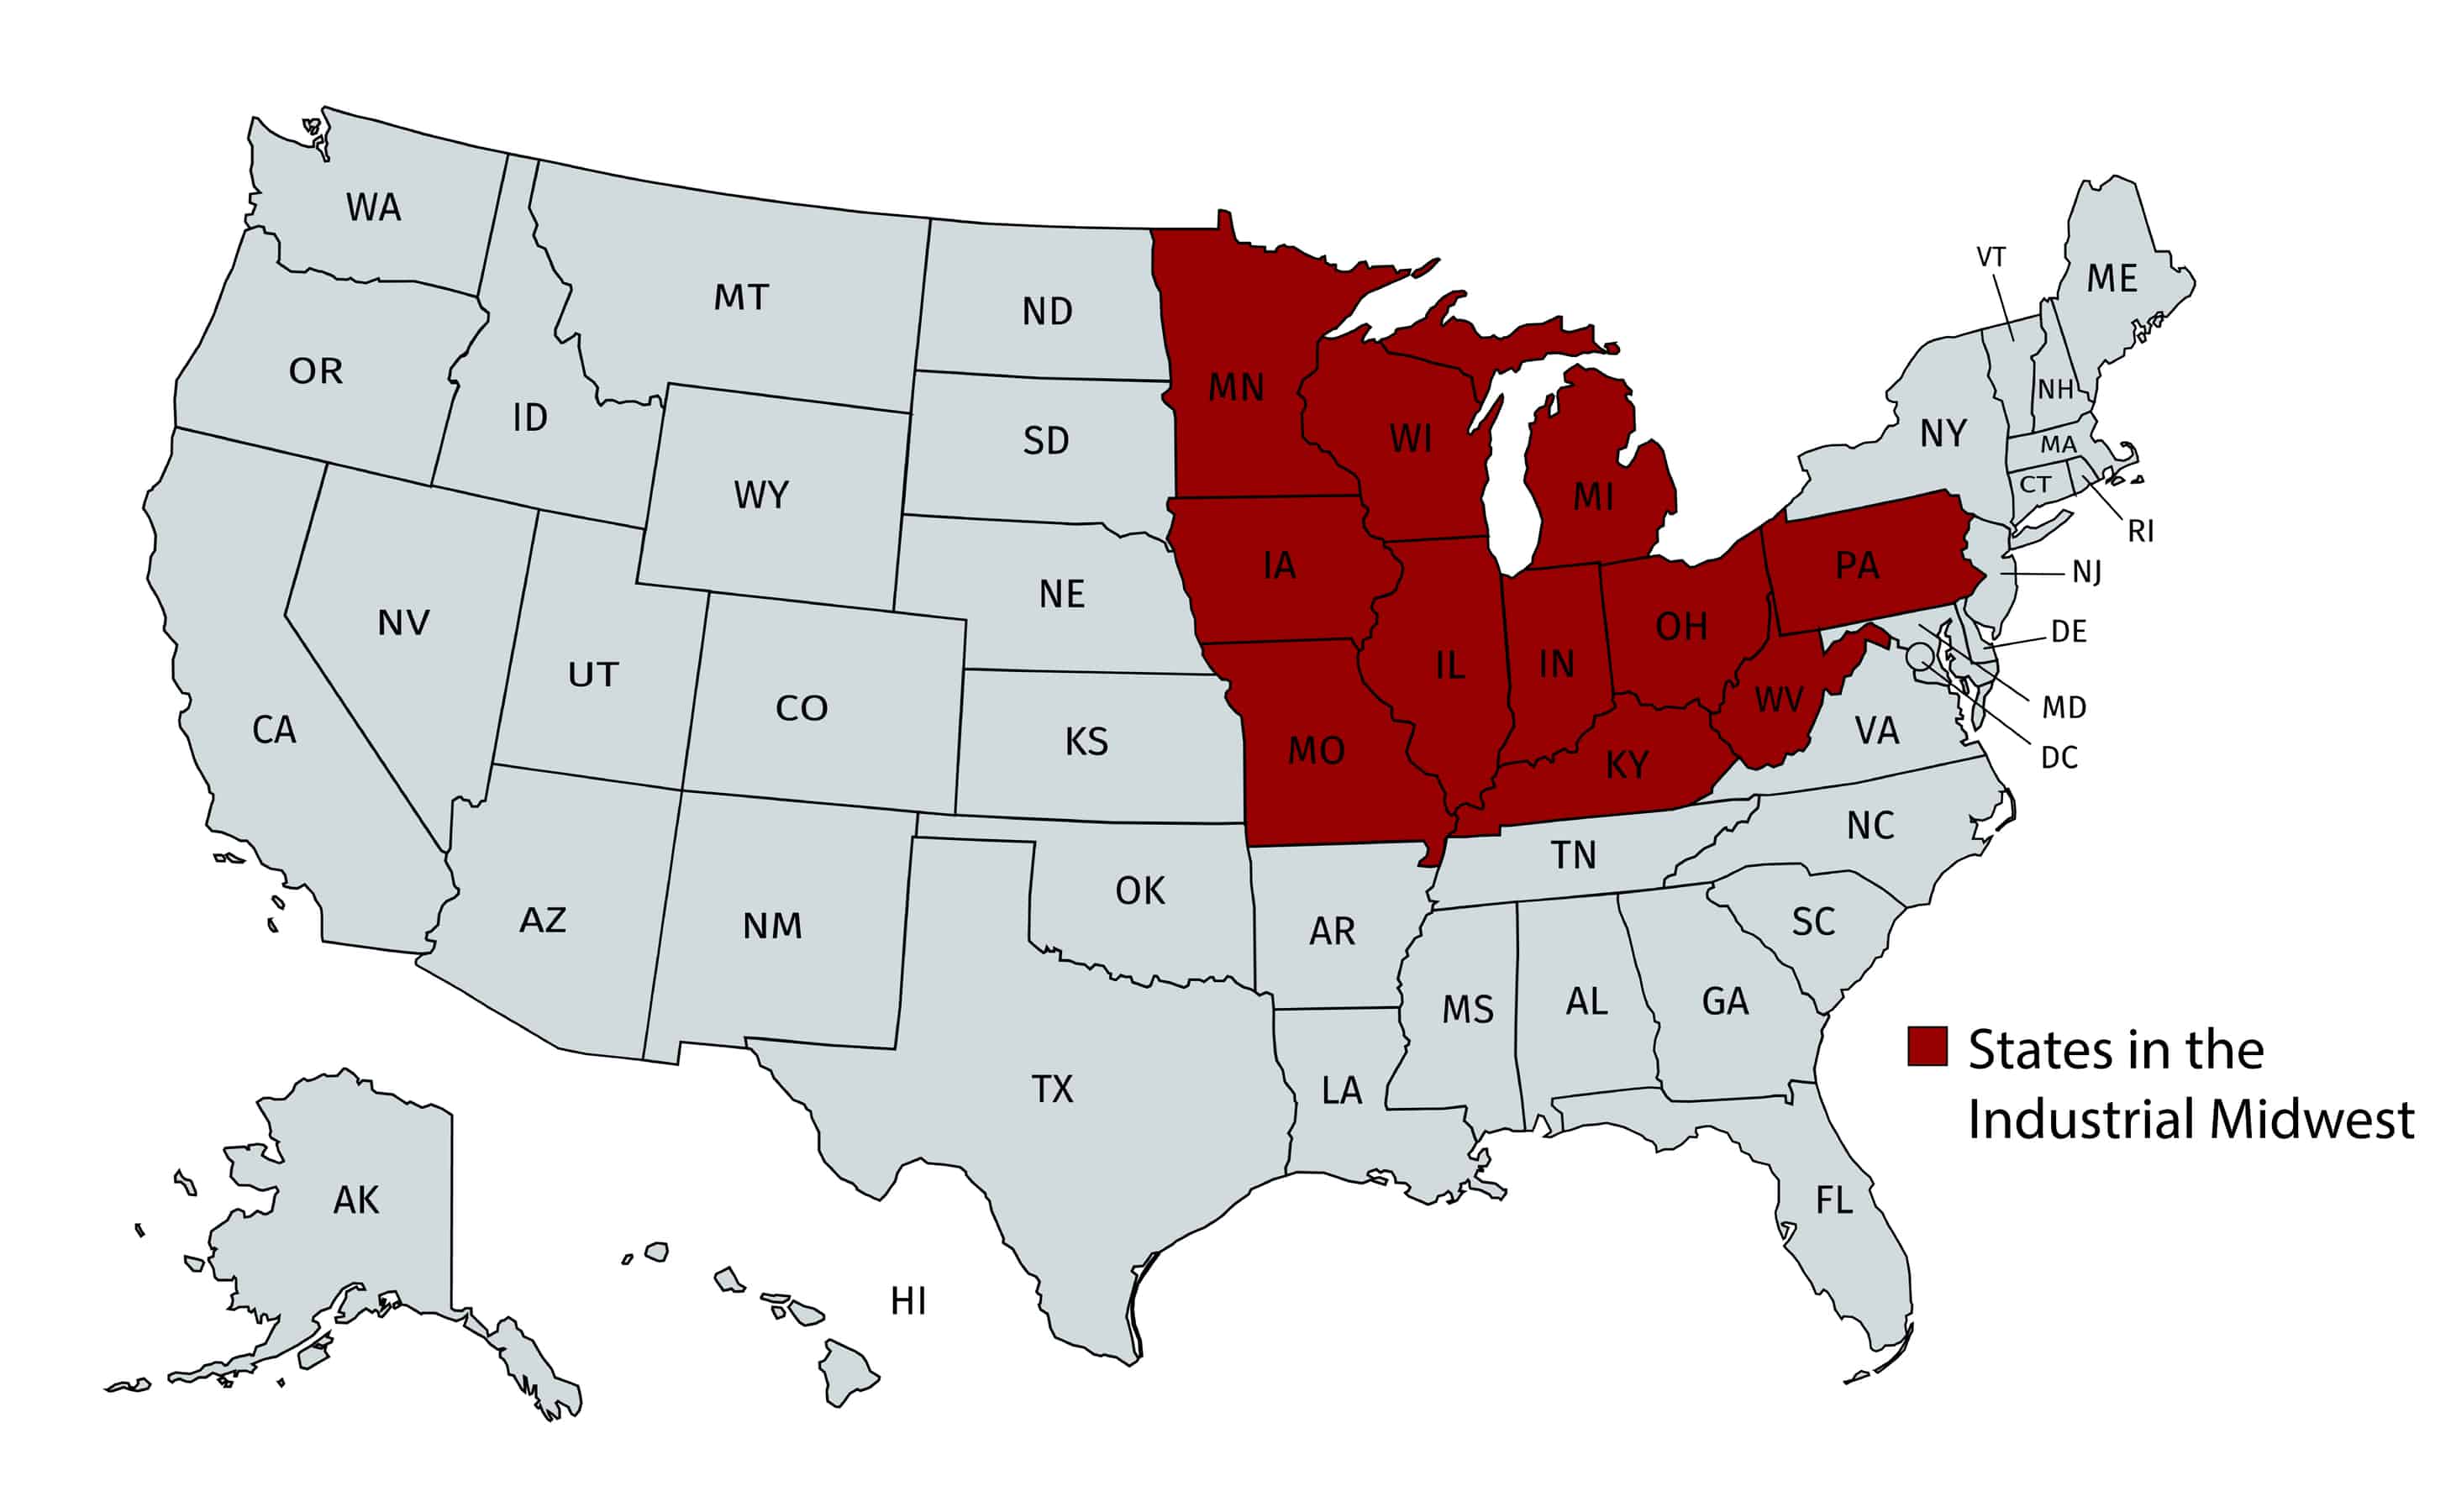
No wonder that policymakers across the political spectrum see creating more manufacturing jobs as a key policy goal. Manufacturing has long been associated with good jobs, in large part because of its strong unions and historically robust labor standards.[iii] This has been particularly true in the Industrial Midwest,[iv] where for decades quality manufacturing jobs enabled residents to build secure middle-class lives. It is important that those values be preserved in today’s growing industry sectors so that the region can sustain its strong and vibrant communities.
Health care is one such growing industry sector—one expected to add more jobs than any other sector over the next decade.[v] Within health care, the hospital industry in particular provides a key example not only of the opportunity that comes from bringing worker voice and improved labor standards to the service sector, but also of the scope of challenges ahead.
In many major cities in the Industrial Midwest, hospitals (or health care systems[vi]) are among the largest private-sector employers. See Appendix A. Hospitals are often the economic anchors of their communities, generating millions of jobs, directly or indirectly.[vii] As a result, hospitals and the wages they pay have an outsized role on the impact of the economic health of communities.
But today, the vast majority of hospital service jobs are not objectively “good jobs.” For every high-paid doctor in the hospital industry in the Industrial Midwest and indeed nationwide, there are more than six workers providing vital supportive services that a strong health care system needs: workers who sterilize surgical instruments, clean hospital rooms, maintain patient files, prepare and deliver food, keep patients clean and comfortable, and transport patients within the hospital.[viii] Today, too many of these jobs fail to pay a living wage, to the detriment of the more than 300,000 workers who hold these jobs in the Industrial Midwest alone, many of whom are women and people of color.
For every highly paid doctor in the hospital industry, there are six workers providing essential supportive services.
We have the opportunity as a nation to improve these jobs by applying key principles from manufacturing jobs—specifically, by improving labor standards and ensuring that workers have voice in the workplace. Raising the minimum wage to $15 per hour and respecting hospital workers’ right to join a union would significantly improve the jobs in the growing hospital industry and the health care sector more broadly.
Service Sector Offers Opportunity to Grow Good Jobs
For many decades, the service sector has driven both employment and employment growth in the United States. Since 1980, the private service sector has added more than 52 million jobs, and by 2016 it represented 83 percent of all private employment. In comparison, manufacturing over this same period has shed six million jobs—a 34 percent drop from 1980—and now represents just 10 percent of all private-sector employment. (See Figure A.)
Health care—one significant component of the service sector—has experienced sharp increases in employment over the last 25 years, adding 6.8 million jobs, a nearly 80 percent increase over that period.[ix] Given these trends, health care today eclipses nearly all other private-sector industry sectors in employment. It is second only to professional and businesses services, and health care is projected to overtake that sector as well by 2024.[x]
Figure A: U.S. Private Service Sector and Manufacturing 1980-2016
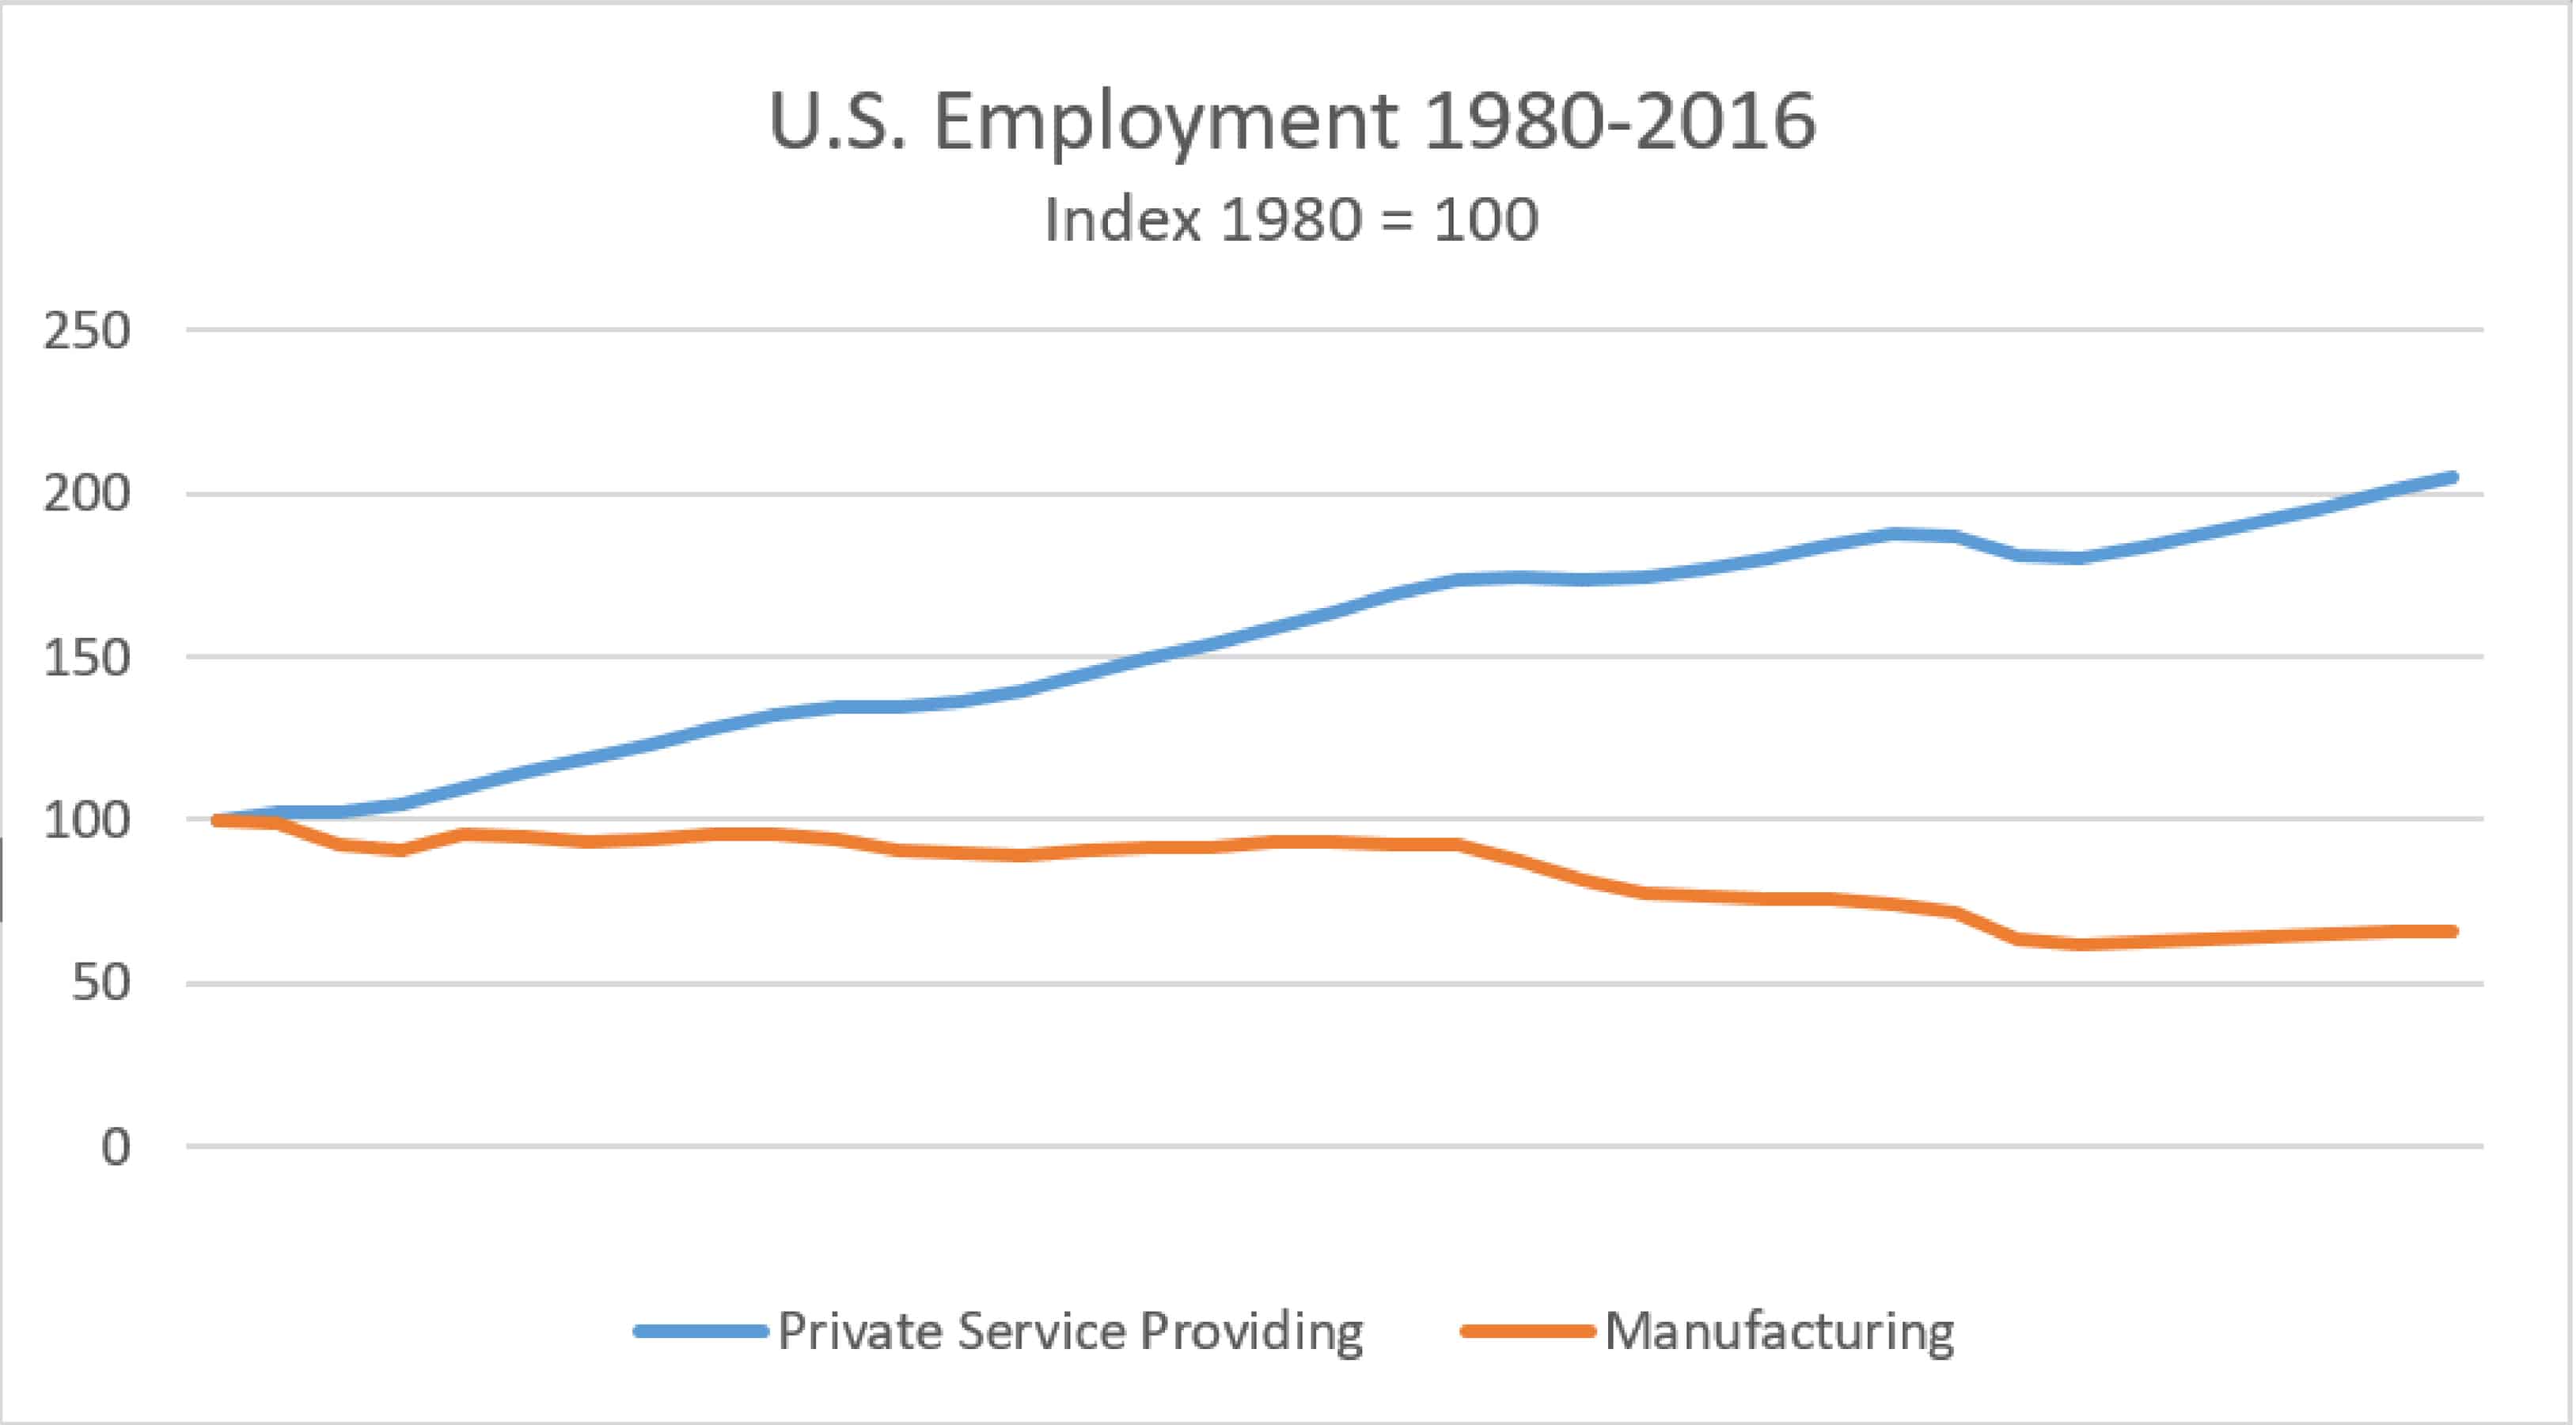
Source: Aggregated data from the U.S. Private Service Sector and Manufacturing 1980-2016, Current Employment Statistics, Bureau of Labor Statistics.
The Industrial Midwest largely mirrors the national trends, with manufacturing losing 1.4 million jobs and health care gaining 1.3 million over the last 16 years. By 2016, health care ended up with a net 780,000 more workers in this region than manufacturing.[xi] (See Figure B.) Within health care, hospitals in particular have grown by 18 percent since 2001.[xii]
Figure B: Industrial Midwest Healthcare and Manufacturing Employment, 2001-2016
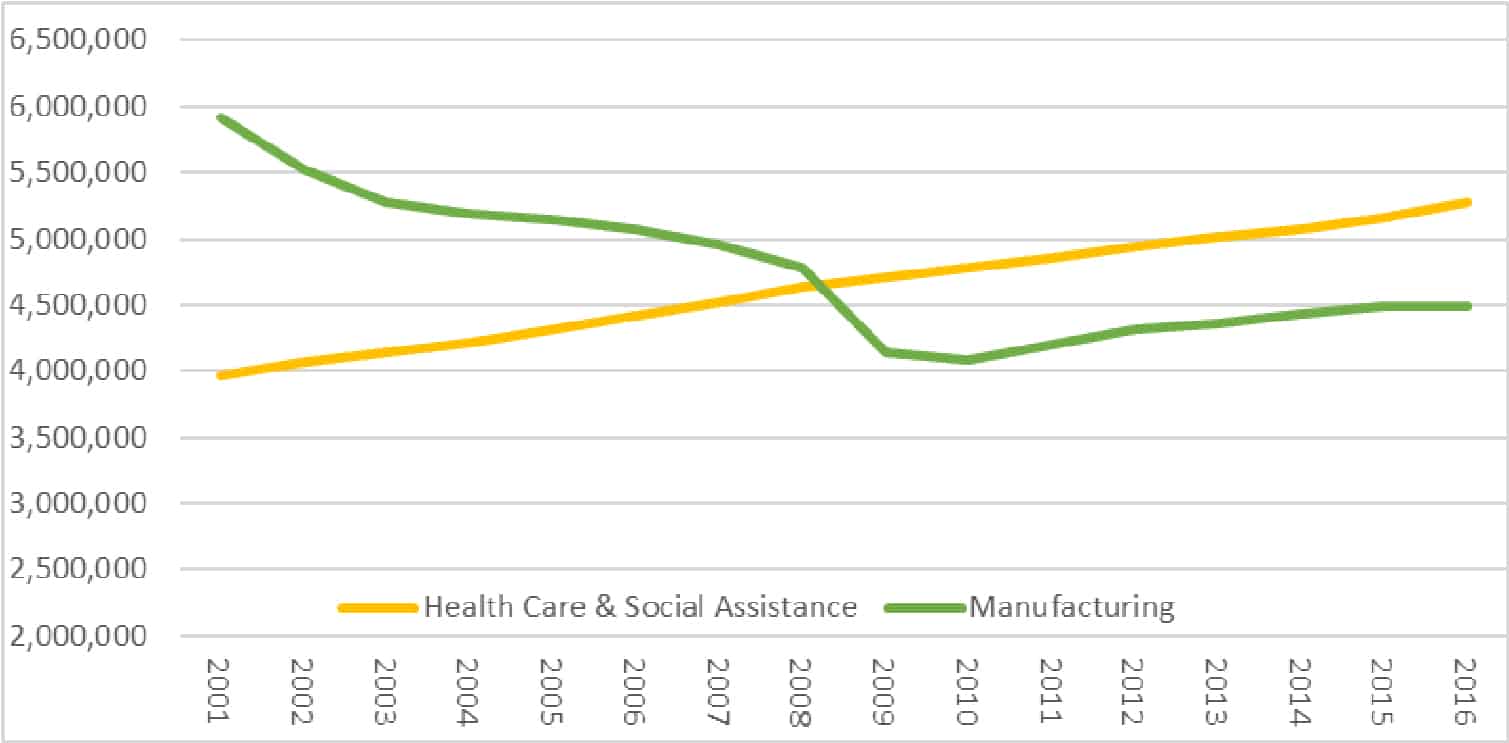
Source: Aggregated data from the Quarterly Census of Employment and Wages, Bureau of Labor Statistics, for the 11 Industrial Midwest states, https://www.bls.gov/cew/.
Health Care Will Continue to Drive Job Growth in Service Sector
According to the latest biennial Bureau of Labor Statistics (BLS) long-term employment projections, health care is currently the fastest-growing industry sector in terms of employment, and it is expected to add the most new jobs nationwide from 2014 to 2024. The sector is projected to grow 21 percent, providing 41 percent of total employment growth over that same period, while manufacturing employment is projected to decrease 7 percent. BLS has also projected that the health care industry will have all five of the top five fastest-growing sectors (by detailed industry), and three of the top 10 sectors adding the most jobs, including the hospital sector, which itself is projected to increase by 394,900 jobs.[xiii] (See Figure C.)
Figure C: BLS Nationwide Employment Projections
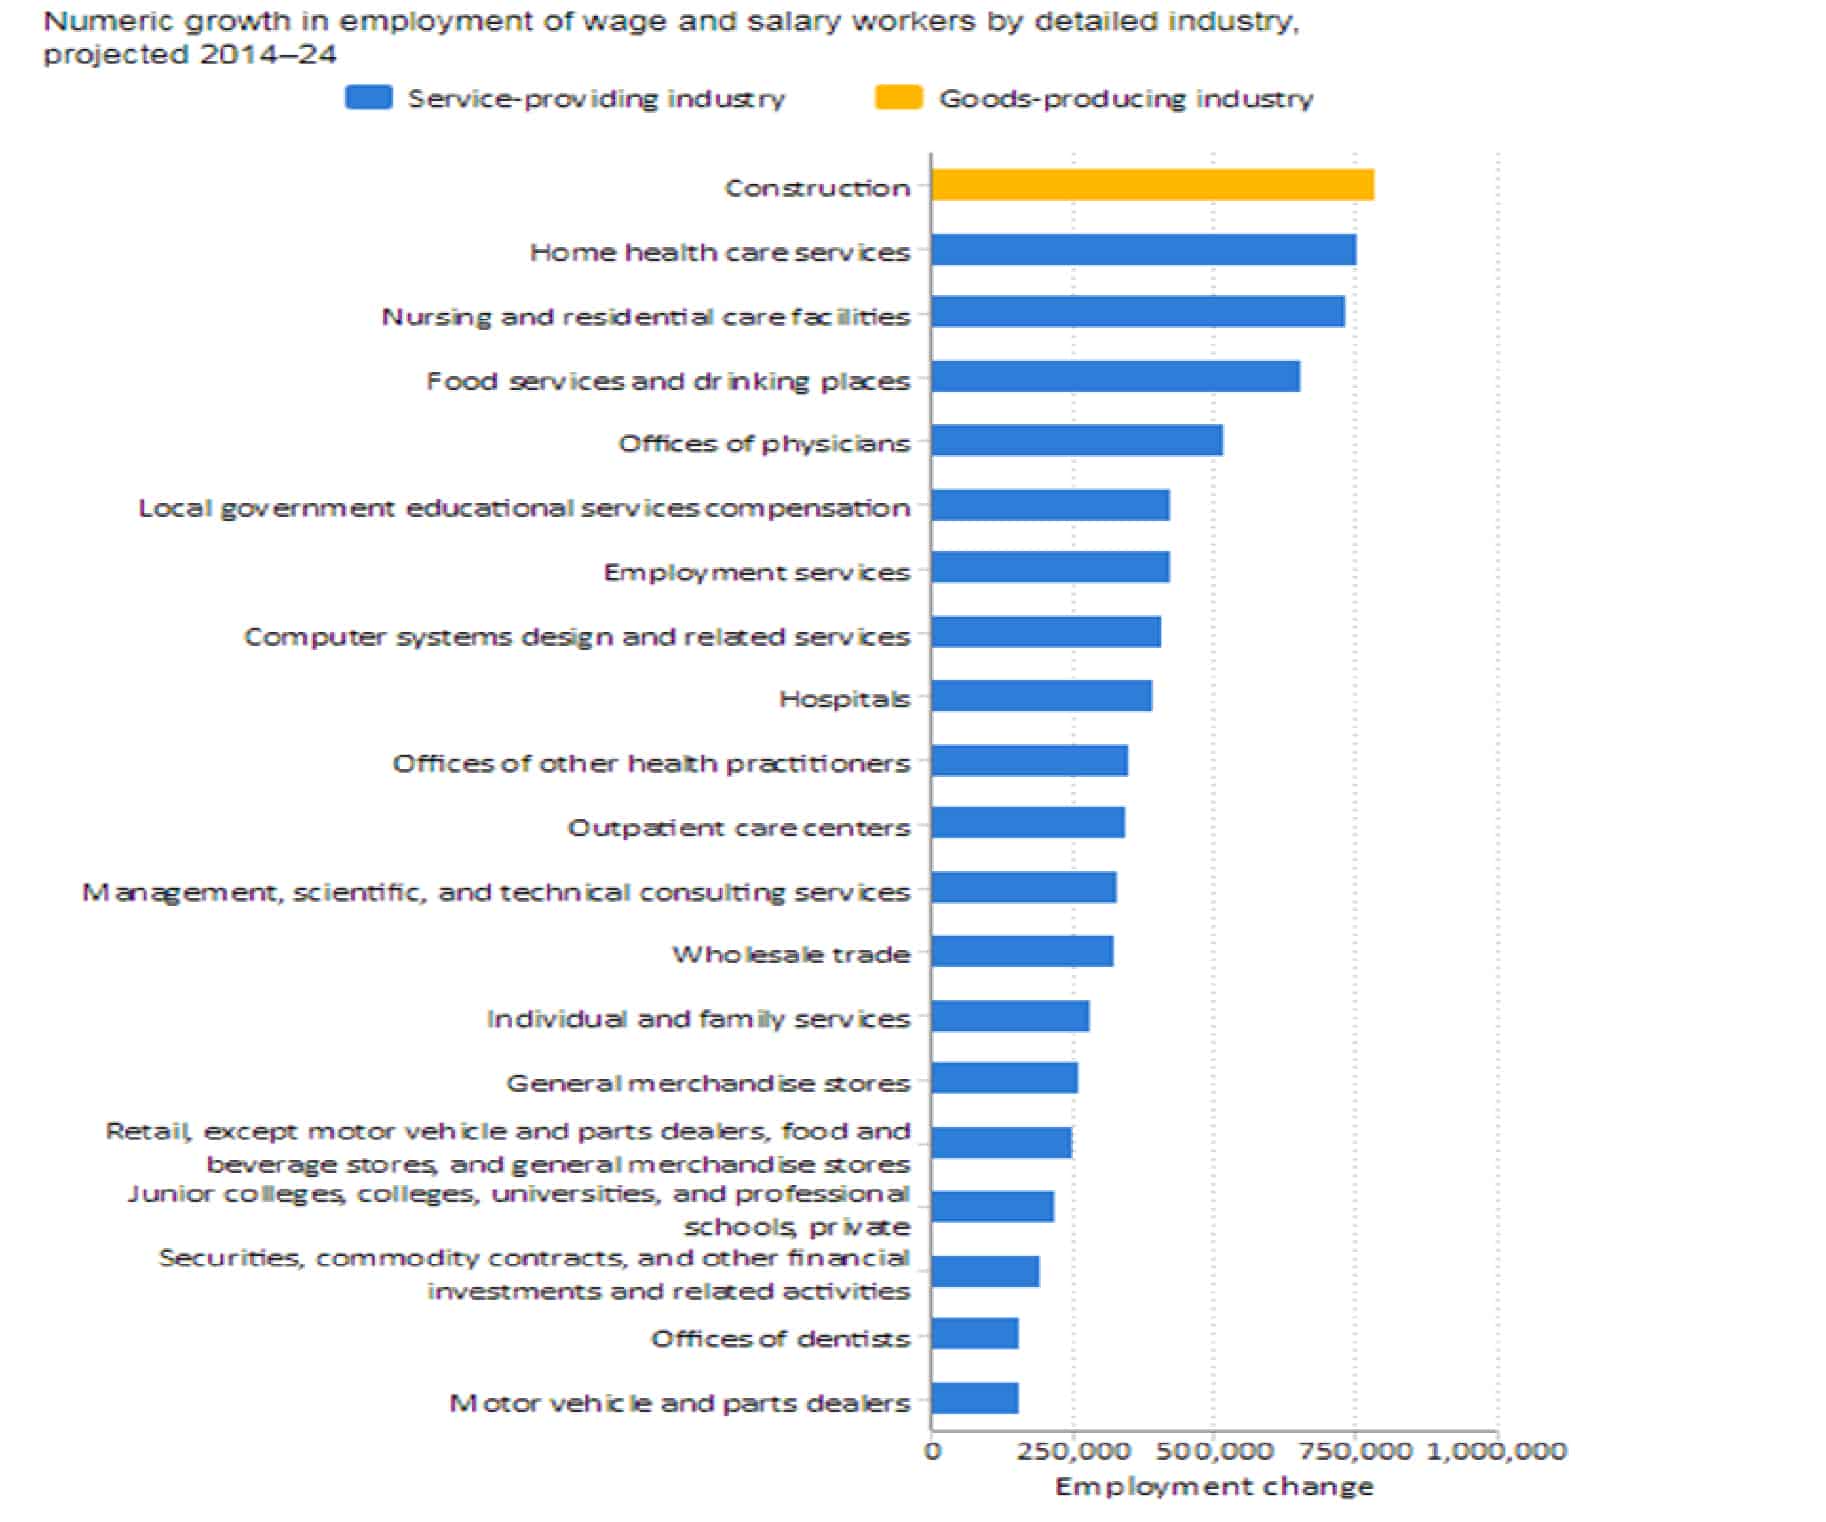
Source: Projections of Industry Employment 2014-24, Bureau of Labor Statistics, https://www.bls.gov/careeroutlook/2015/article/projections-industry.htm.
Most states produce their own projections of job growth that largely parallel the national predictions. In 10 of the Industrial Midwest states identified above (all but Kentucky), the health care sector in aggregate is projected to add more than 650,000 jobs in the decade ending in 2024—a 13 percent increase from 2014—including 120,000 in hospitals.[xiv] Over the same period, manufacturing in the region is projected to experience net job loss, including in seven of the 10 states that make projections. [xv]
Seventy Percent of Service Workers in Hospitals Earn Less Than $15 an Hour
For every higher-paid doctor in hospitals in the Industrial Midwest, there are more than six service workers in hospitals who perform a variety of important functions related to ensuring that patients get proper medical care. This work includes tending to patients, transferring patients, cleaning, stocking supplies and equipment, cooking, food and drink preparation, processing specimens, completing and managing drug orders, sterilizing surgical instruments, and transporting patients, among other critical tasks. More than one million of the nation’s hospital workers are employed in the three broad occupational categories that capture this work—healthcare support, food preparation and service, and building and grounds cleaning.[xvi] Table 1 provides representative occupational titles under each of these groups.
Table 1: Representative Service Workers in Hospitals
| Major Group(Occupation Code) | |||
| Healthcare Support (31-0000) |
Food Preparation & Service (35-0000) |
Building & Grounds Cleaning & Maintenance (37-0000) |
|
|
Representative Occupational Titles
|
Nursing Assistants;
Phlebotomists |
Cooks;
Institution & Cafeteria Food Preparation Workers; Food Servers, Nonrestaurant
|
Janitors & Cleaners;
Maids & Housekeeping Cleaners |
The hospital industry is a major driver of our economy.[xvii] In 2015, the broader set of health care spending represented 18 percent of the U.S. gross domestic product; it is projected to reach 20 percent by 2025.[xviii] Hospitals represent the single largest component of the health care sector and the second-largest source of private-sector jobs overall, employing more than 5.4 million people, according to industry analysis.[xix] Often the largest employers in their communities, hospitals thus have both the opportunity and responsibility not only to provide high-quality care to their patients; they can and must incubate good jobs in their communities, laying the foundation for long-term economic growth and community stability.[xx]
Seventy percent of hospital service workers nationwide—and 71 percent in the Industrial Midwest—are paid less than $15 an hour.
But our analysis of government data finds that America’s hospitals are not fulfilling this promise. Across the country, 70 percent of hospital service workers are paid less than $15 an hour—an amount that a single adult living anywhere in America would need to cover the basics, let alone expenses related to raising children or supporting a family.[xxi] In the Industrial Midwest, 71 percent of all hospital service workers are paid less than $15 an hour.[xxii]
Women and People of Color Hold Majority of Hospital Service Jobs in Industrial Midwest
Women and people of color disproportionately hold service jobs in hospitals, including in the Industrial Midwest. According to our analysis of U.S. Equal Employment Opportunity Commission data,[xxiii] in the 14 metropolitan areas with a population of more than one million in the Industrial Midwest states, the vast majority of the hospital service workforce is made up of women, and nearly half of the overall workforce are non-white (Table 2). This means that hospitals that pay low wages amplify and reinforce gendered and racialized patterns of income inequality, given that the majority of African Americans and Latino workers, and nearly half of women workers, make less than $15 per hour.[xxiv] But those hospitals that take on the challenge to create good jobs have a powerful opportunity to make a difference in addressing structural inequality in our economy.
Table 2: Demographics of Hospital Service Workers in Large Industrial Midwest Metro Areas
Race & Gender Identification |
Share of Hospital Service Workers |
| Total Non-White | 49% |
| Women | 68% |
| Black | 37% |
| Black Men | 13% |
| Black Women | 24% |
| Hispanic | 5% |
The Prescription: Worker Voice and Strong Labor Standards
The same one-two punch that transformed manufacturing into the 20th century’s good-jobs generator can drive creation of good jobs in hospitals and health care more broadly. The starting points for this transformation are higher wages and worker voice.
Higher minimum wages would immediately raise the wages of hospital service workers earning less than $15—a much-needed economic boost for workers in the Industrial Midwest and throughout the country. As outlined previously, at least 70 percent of hospital service workers—and 71 percent of all hospital service workers in the Industrial Midwest—would get a raise with such a policy.
Ensuring that workers have a voice in the terms and conditions of their work does even more to create good jobs. To illustrate the role of unions in boosting hospital service workers, Table 3 captures the starting hourly wage for union hospital service workers in Seattle, New York, and Oakland, all of which are higher than the $15 mark.[xxv]
Table 3: Hourly Starting Wage for Union Workers
Occupation |
Kaiser Permanente, Northern California |
League of Voluntary Hospitals & Homes of New York |
Swedish Medical Center (Seattle) |
| CNA | $25.58 | $18.20 | |
| Cook | $27.36 | $23.26 | $17.11 |
| Dishwashers | $18.05 | ||
| Food Server | $24.38 | $18.05 | $16.11 |
| Housekeeping Cleaner | $24.66 | $18.05 | $15.34 |
| Laundry | $18.05 | $15.08 | |
| Parking Lot Attendant | $24.49 | ||
| Patient Transport | $24.06 | $15.34 | |
| Shuttle Driver | $24.87 | $18.83 | $16.42 |
Worker voice does more than improve the quality of hospital workers’ jobs: it helps ensure that hospital service workers provide the best possible patient care. For example, a team of economists recently completed an empirical analysis of hospital unionization in California between 1996 and 2005; they found that hospitals where key caregivers were unionized outperformed hospitals that were not unionized in 12 of 13 “nurse-sensitive” patient outcomes, after accounting for hospital-specific trends.[xxvi] The authors found that after nurses were unionized, hospitals had significant drops in the incidence of everything from sugar shock from diabetes to delusion, disorientation, and depression.[xxvii] They suggest numerous possible explanations, including that higher wages may result in “increasing [employee] effort, reduced turnover, and possibly increasing morale.”[xxviii] That rationale could suggest similar benefits from unionizing hospital support workers as well.
Conclusion
One of the key lessons of the 20th century is that solid investment in high-growth industries, through strong labor standards and robust worker organization, can convert even dirty and dangerous work into good middle-class jobs that nurture and sustain working people and their families and communities. A similar commitment to good health care jobs, particularly in low-wage hospital positions, can transform the 21st century’s high-growth sectors into ladders out of poverty and into a thriving middle class.
Notes on Methodology
Estimating the number and share of workers making less than $15 per hour:
The bulk of our analysis in this study uses data from the Current Population Survey (CPS), the primary government survey containing information on wages and hours. The CPS is a monthly national survey of approximately 60,000 households that is representative of the U.S. non-institutional population aged 16 and older. We used the Current Population Survey Merged Outgoing Rotation Groups (CPS ORG) files made publicly available by the National Bureau of Economic Research (NBER). We defined hospital service workers to include workers classified in the Census Industrial Classification as 8190 (Hospitals) in these three occupations: healthcare support occupations; food preparation and serving-related occupations; and building and grounds cleaning and maintenance occupations. In order to have a sample sufficiently large to analyze specific occupations and industries, our analysis combines data from the last three consecutive years available (2014-2016). We use wage variables in which all values have been converted to 2016 dollars. Our sample includes private- and public-sector, hourly and salaried workers. We exclude self-employed workers. For non-hourly workers, hourly wages are calculated using reported hours worked. The figures we report are calculated from hourly earnings that do not include tips, overtime, and commission. Note that there is a tendency for workers to report hourly earnings in round numbers, which causes percentiles of the distribution to “clump” at whole-dollar values. Our analysis does not “smooth” wages to correct for this source of measurement error. For calculations involving wages, we only include respondents for whom wage data are available.
Download full report below to see the Appendix.
[i] Productivity gains have plateaued in recent years. See Mitchell Hartman, “What Killed U.S. Productivity?,” Marketplace, January 10, 2017, accessed August 16, 2017, https://www.marketplace.org/2017/01/10/world/what-killed-us-productivity. But total productivity continues inching up—1.2% from the second quarter of 2016 to the second quarter of 2017, due to a combination of increases in output (2.7%) and hours worked (1.5%). “Second Quarter 2017 Productivity and Costs Report,” Bureau of Labor Statistics, accessed August 16, 2017, https://www.bls.gov/news.release/prod2.nr0.htm.
[ii] The national unemployment rate has dipped to 4.3%, which is the lowest rate in a decade. “Labor Force Statistics from the Current Population Survey,” Bureau of Labor Statistics, accessed August 16, 2017, https://data.bls.gov/timeseries/LNS14000000. But workers across the country still feel acute economic anxiety, which has a number of drivers. See, e.g., Keith Payne, The Broken Ladder: How Inequality Affects the Way We Think, Live, and Die (New York: Viking, 2017) (inequality); Bivens, Josh, and & Lawrence Mishel, “Understanding the History Divergence Between Productivity and a Typical Worker’s Pay: Why It Matters and Why It’s Real,” Economic Policy Institute, September 2, 2015, http://www.epi.org/publication/understanding-the-historic-divergence-between-productivity-and-a-typical-workers-pay-why-it-matters-and-why-its-real/; Gina Kolata, Death Rates Rising for Middle-Aged White Americans, Study Finds, https://www.nytimes.com/2015/11/03/health/death-rates-rising-for-middle-aged-white-americans-study-finds.html?_r=0 (life expectancy).
[iii] See, e.g., Ben Casselman, “Americans Don’t Miss Manufacturing—They Miss Unions,” FiveThirtyEight (2016), https://fivethirtyeight.com/features/americans-dont-miss-manufacturing-they-miss-unions/.
[iv] See ibid.
[v] “Employment Projections: 2014-24 Summary,” accessed August 17, 2017, https://www.bls.gov/news.release/ecopro.nr0.htm.
[vi] Hospitals are often referred to as health systems to describe the breadth of inpatient and outpatient services they provide.
[vii] American Hospital Association (AHA), “Hospitals are Economic Anchors in their Communities,” accessed August 17, 2017, http://www.aha.org/content/17/17econcontribution.pdf. According the AHA, “…the importance of hospitals to their communities extends far beyond health care,” touting the millions of workers hospitals employ both directly and indirectly through their economic activity. Ibid.
[viii] Aggregated data from the Occupational Employment Statistics, Bureau of Labor Statistics, for the eleven Industrial Midwest states, https://www.bls.gov/oes/.
[ix] Current Employment Statistics 1980-2016, https://www.bls.gov/ces/.
[x] “Employment by Major Industry Sector,” Bureau of Labor Statistics, accessed August 17, 2017, https://www.bls.gov/emp/ep_table_201.htm.
[xi] Aggregated data from the Quarterly Census of Employment and Wages, BLS, for the eleven Industrial Midwest states, https://www.bls.gov/cew/.
[xii] Ibid.
[xiii] Bureau of Labor Statistics, “Projections of Industry Employment, 2014–24,” accessed August 17, 2017, https://www.bls.gov/careeroutlook/2015/article/projections-industry.htm.
[xiv] See “Illinois Employment Projections,” Illinois Department of Employment Security, accessed August 17, 2017, http://www.ides.illinois.gov/LMI/Pages/Employment_Projections.aspx; “Indiana Industry Projections,” Hoosiers by the Numbers,” accessed August 17, 2017, http://www.hoosierdata.in.gov/dpage.asp?id=57&page_path=Industry%20Data&path_id=7&menu_level=smenu1&panel_number=2; “Iowa Industry Projections,” Iowa Workforce Development, accessed August 17, 2017, https://www.iowaworkforcedevelopment.gov/industry-projections; “Michigan Data Search,” Michigan Department of Technology, Management and Budget, accessed August 17, 2017, http://milmi.org/datasearch/projections-excel); “Minnesota Employment Outlook,” Minnesota Employment and Economic Development, accessed August 17, 2017, https://apps.deed.state.mn.us/lmi/projections/EmploymentOutlook.aspx; “Missouri Industry Employment Projections,” Missouri Economic Research and Information Center, accessed August 17, 2017, https://www.missourieconomy.org/industry/indprj/?naics=611300&prj=lt; “Ohio Employment Projections,” Ohio Department of Job and Family Services, accessed August 17, 2017, http://ohiolmi.com/proj/projections.htm; “Pennsylvania Industry Employment 2014-2024 Long-Term Projections,” Pennsylvania Center for Workforce Information and Analysis, accessed August 17, 2017, http://www.workstats.dli.pa.gov/Documents/Projections/Industrial/PA/PA_LTIP.pdf; “West Virginia Industry Projections,” Workforce West Virginia, accessed August 17, 2017, http://lmi.workforcewv.org/LTprojections/LTIndustryProjections.html; and “Wisconsin Long Term Industry Employment Projections, 2014-2024,” Wisconsin’s Worknet, accessed August 17, 2017, http://worknet.wisconsin.gov/worknet_info/downloads/INDPRJ/lt_ind_2014.xlsx. Kentucky does not provide state projection data.
[xv] Ibid.
[xvi] Author’s Analysis of Current Population Survey Merged Outgoing Rotation Group 2014-2016.
[xvii] “Hospitals Are Economic Anchors in Their Communities,” American Hospital Association, accessed August 17, 2017, http://www.aha.org/content/17/17econcontribution.pdf; “Hospitals as Employers,” American Hospital Association, accessed August 17, 2017, http://www.aha.org/content/11/110909-employer.pdf.
[xviii] “National Health Expenditure Projections 2016-2025,” Centers for Medicare and Medicaid Services, accessed August 17, 2017, https://www.cms.gov/Research-Statistics-Data-and-Systems/Statistics-Trends-and-Reports/NationalHealthExpendData/Downloads/proj2016.pdf.
[xix] “Cuts Threaten Hospitals’ Ability to Cure and Care,” American Hospital Association, accessed August 17, 2017, http://www.aha.org/content/11/110909-employer.pdf.
[xx] Harkavy, Ira and Harmon Zuckerman, “Eds and Meds: Cities Hidden Assets,” accessed August 17, 2017, http://staging.community-wealth.org/sites/clone.community-wealth.org/files/downloads/report-harkavy.pdf
[xxi] Author’s Analysis of Current Population Survey Merged Outgoing Rotation Group 2014-2016. See also “Our Nations Workers Need a Federal Minimum Wage They Can Rely On,” National Employment Law Project, accessed August 17, 2017, https://www.nelp.org/news-releases/our-nations-workers-need-a-federal-minimum-wage-they-can-live-on/.
[xxii] Ibid. For workers in the three broad occupational categories that capture hospital service work—healthcare support, food preparation and service, and building and grounds cleaning—the share earning less than $15 is 71% in the Industrial Midwest.
[xxiii] All private hospitals file an EEO-1 survey annually with the U.S. Equal Employment Opportunity Commission (EEOC) which requires company employment data to be categorized by race/ethnicity, gender and job category. “Job Patterns For Minorities And Women In Private Industry: A Glossary,” EEOC, accessed August 17, 2017, https://www.eeoc.gov/eeoc/statistics/employment/jobpat-eeo1/glossary.cfm. Although the data are confidential, the EEOC does make certain data available in an aggregated format for major geographic areas and by industry group.
[xxiv] Huizar, Laura and Tsedeye Gebreselassie, “What a $15 Minimum Wage Means for Women and Workers of Color,” accessed August 17, 2017, https://www.nelp.org/wp-content/uploads/Policy-Brief-15-Minimum-Wage-Women-Workers-of-Color.pdf.
[xxv] Author’s analysis of relevant collective bargaining agreements.
[xxvi] Dube, Arindrajit, Ethan Kaplan, and Owen Thompson, “Nurse Unions and Patient Outcomes,” accessed August 17, 2017, http://econweb.umd.edu/~kaplan/NurseUnions.pdf p.817.
[xxvii] Ibid. at 816.
[xxviii] Ibid. at 827.
© 2017 National Employment Law Project. This report is covered by the Creative Commons “Attribution-NonCommercial-NoDerivs” license fee (see http://creativecommons.org/licenses). For further inquiries, please contact NELP (nelp@nelp.org).
Related to
Loading